

Today I’m extremely happy to be bringing you the latest from my friend Lyn Alden.
Lyn’s background bridges the fields of engineering and finance. She holds a bachelor’s degree in electrical engineering and a master’s degree in engineering management, specializing in engineering economics, systems engineering, and financial modeling. Her early career included roles as an electrical engineer and later an engineering lead at the Federal Aviation Administration’s William J. Hughes Technical Center.

Alden has been a passionate investor for years. From 2010 to 2015, she ran her first investing website as a part-time venture, eventually selling it to a larger publishing company. In late 2016, she founded Lyn Alden Investment Strategy, a research firm that grew significantly, leading her to leave engineering management in 2021 to focus on finance full-time.
Now an independent analyst, Alden aims to deliver institutional-level research in clear, accessible language for both professional and retail investors. She also serves as an independent director on the board of Swan.com and is a general partner at the venture capital firm Ego Death Capital. In 2023, she published the best-selling book Broken Money (congrats on more than 100,000 copies sold, Lyn!) exploring the history, present, and future of money through a technological lens.
Lyn is an investor I always read and always love to hear from, so I was grateful she gave me permission to share this month’s research with my subscribers. I’m sure you’ll find it as valuable as I do.
A Flywheel of Chaos
March 22, 2026
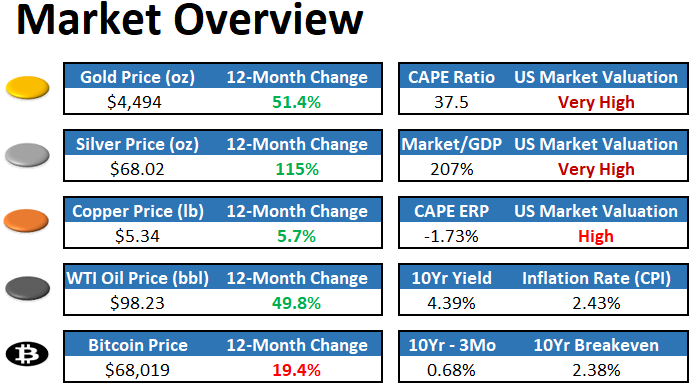
This newsletter issue discusses the self-reinforcing nature of geopolitical crises, and explores to what extent the war against Iran challenges the “gradual print” thesis I’ve been discussing in recent issues.
And for readers who enjoy fiction, I’m happy to announce that my new sci fi thriller is now available! You can find it on Amazon or Barnes & Noble, or read more about it here.

The Gradual Print Recap
During my September interview with Natalie Brunell, and then in my December newsletter issue, I discussed how the overnight financing markets were running into liquidity shortages, and that the Fed would likely begin gradual balance sheet expansion in the not-too-distant future. In contrast to some that have been calling for a large upcoming period of money-printing, I’ve referred to this as the “gradual print” due to an expectation of mild-to-moderate balance sheet expansion over the next year rather than something larger.
Shortly after that, the Fed did announce that they would begin expanding their balance sheet on an ongoing basis, in order to maintain what they consider to be ample reserves in the banking system and to maintain control of interest rates. We’re now over three months into this new, gradual trend.
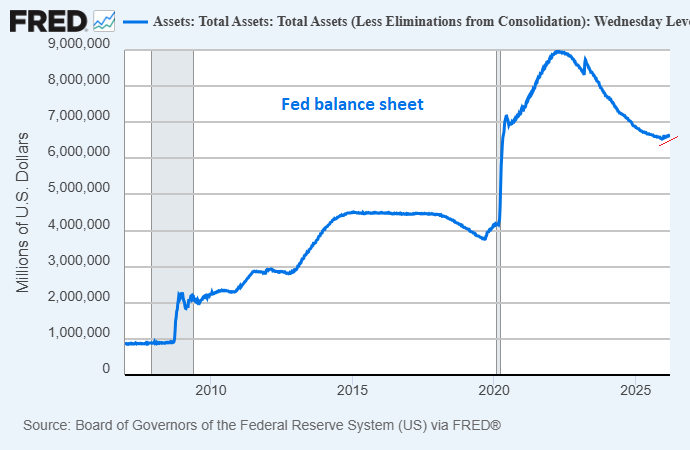
Then, in my February issue, I provided an update on this gradual print which was underway, and contextually quantified the sizes of the prior four notable rounds of balance sheet expansion by the Fed:
-QE 1 was about a $1.3 trillion increase (an approximately 140% gain relative to the starting size) in a few months.
-QE 2 was about a $600 billion increase (an approximately 25% gain relative to the starting size) in less than a year.
-QE3 was about a $1.5 trillion increase (an approximately 50% gain relative to the starting size) in a little under two years.
-QE4 was a massive $4.8 trillion increase (an approximately 115% gain relative to the starting size) in about two years.
Compared to those figures, $220 billion to $375 billion [that the Fed is projecting for 2026] is not a ton. That’s about a 3% to 6% gain relative to the $6.5 trillion starting size as of mid-December. Even if we double the high end estimate to $750 billion due to unforeseen circumstances (an 11% gain relative to the starting size), then that’s still pretty modest.
I then explored various “above baseline scenarios” that could turn it into a bigger print than that. The three main categories included 1) recession, 2) financial war between major powers, or 3) kinetic war between major powers. I also defined a rough cut-off point in which I’d consider a print to be truly “big” rather than “gradual”:
However, the system is already at numbers so large that even $1 trillion of rapid Fed QE is not what it used to be, when the starting balance sheet is over $6.5 trillion. That would only be a 15% increase, which is material but not earth-shaking. It would take $2+ trillion for me to consider a round of money-printing to be “big” at this point.
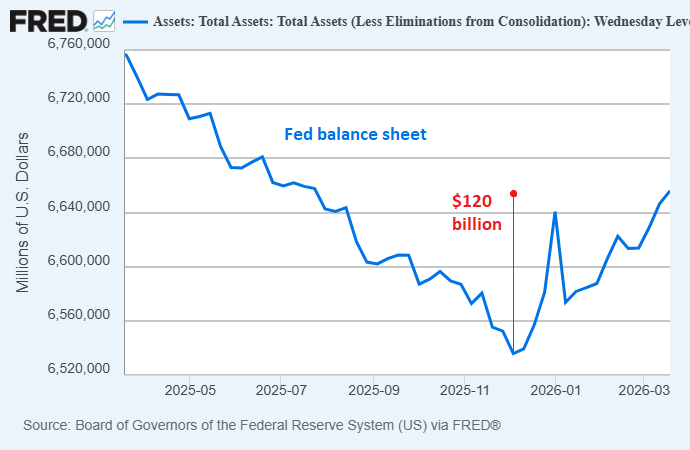
Currently, the balance sheet is up $120 billion from its low point in early December, which would be about $420 billion annually if sustained at this rate all year. Quite gradual.
Adding War to the Mix
Now, we’re already starting to dabble in the early stages of potential “above baseline scenarios”.
First, recession risks are inching up. In particular, total employment levels have hit stall speed, with no net jobs added to the US economy since April 2025.
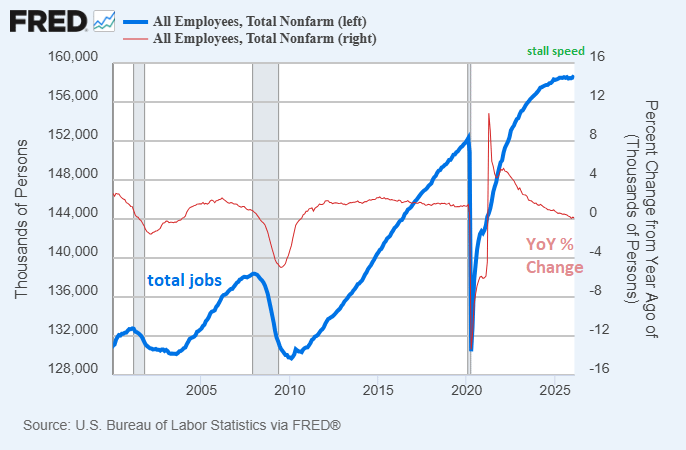
There are a lot of moving parts within those job numbers, ranging from AI productivity impacts to changes in net migration, and everything in between.
Weekly jobless claims, however, show no acute employment stress yet. Consumer sentiment remains historically low, while purchasing manager’s indices are headed up. Overall lending activity is occurring at a reasonable pace. Mixed signals, in other words.
Overall, between the strong areas and the weak areas, there is nothing in the pre-war economic data that I find to be a high-probability catalyst for the Fed to print a ton of money here in 2026.
Enter: the war against Iran.
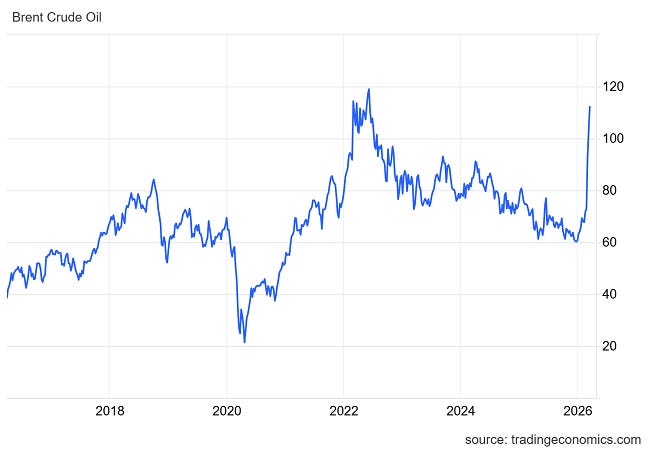
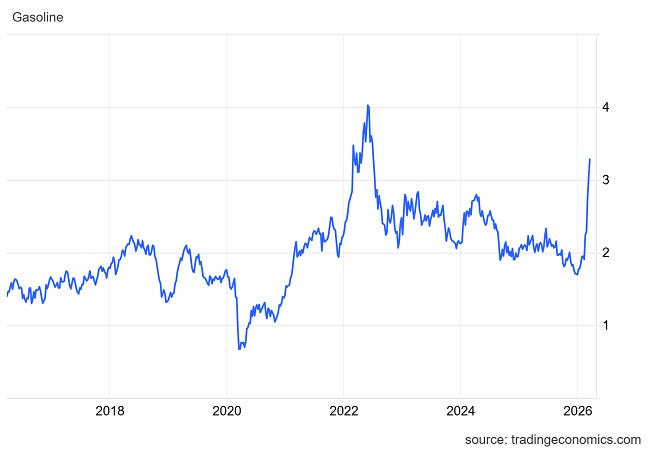
We’re now more than three weeks into the war against Iran by the United States and Israel, and the Strait of Hormuz remains mostly closed, while energy prices have spiked.
Oil:
Gasoline:
Prior to the disruption, approximately 20% of global oil and other hydrocarbon liquids production would go from Persian Gulf producers through the Strait of Hormuz and then to the rest of the world. Most of it heads east toward Asia, but because many of these markets are somewhat fungible, they can bid for other sources of oil, LNG, and liquids products that are produced around the world and compete with western consumers and emerging market consumers to a significant extent as well.
In practice, this translates into higher prices at the pump, higher natural gas prices for LNG-importing nations (which the US is fortunately buffered from since natural gas is a less fungible market), and price spikes in all sorts of feedstocks and byproducts that serve as foundational inputs to fertilizer, chemical, and metallurgical, electronics, and medical supply chains. If it goes on long enough, the price spikes can turn into outright shortages or rationing, which risks triggering depression scenarios rather than merely recession scenarios.
I purposely follow the work of specialists in various fields, and I pick ones with a high signal-to-noise ratio that aren’t permabulls or permabears, and that generally shun sensationalism. That being said, the oil analysts I follow are absolutely freaking out about this. A prolonged closure of the Strait of Hormuz is the one thing that has basically kept them up at night while being sanguine about most other types of energy shortages.
Early reports suggested that President Trump and his administration expected a quick victory over Iran, especially considering that Iran’s long-time supreme leader, Ali Khamenei, was killed early in the action.
However, as of this writing, despite numerous deaths among Iran’s senior leadership, they continue to keep heavy pressure on the strait. Meanwhile, Iran has been struck in some of its key energy infrastructure, and has struck at key energy infrastructure across the Persian Gulf and further out onto the coasts of the Arabian Sea and Red Sea.
Last week, during the third week of the war, the Pentagon asked the White House to request $200 billion from Congress to fund the ongoing war against Iran. However, the Democratic side is largely opposed to that funding, and even the Republican side is somewhat mixed. In context, this number equates to approximately $1,500 in spending per American household.
As outlined earlier, however, none of these proposed numbers are reaching outside of the “gradual print” zone yet. It’s not fully clear that the $200 billion for ongoing war will be provided, and if it is, a lot of it will likely be funded without additional money-printing by the Fed (at least, above the gradual print that they’re doing already). And even if it were to all be funded by the Fed, it still wouldn’t approach a truly big print as defined earlier.
The Toxic Combo
Now, where I can see a significantly above-baseline scenario occurring, is if this conflict stretches on for months and with some of the worst outcomes occurring in terms of energy infrastructure damage (which can then take months or years to repair). Unfortunately, the odds for that are grinding higher over time. Enough catalysts together can create the need for a “big print”.
What would this look like? It’s impossible to say precisely, but we can outline the general shape of it:
-The longer the strait remains closed without viable alternatives, and the more energy infrastructure is damaged, the more likely high energy prices and/or shortages are to persist, along with disruptions in the supply chains of various other byproducts and feedstocks.
-Sustained high energy prices would put pressure on consumers globally, which would displace their ability to spend elsewhere. For some energy-starved nations, in severe scenarios they might have to sell sovereign reserves or other financial assets, which include US treasury securities, gold, and other assets, in order to buy their required energy imports. Still other places might experience outright shortages which can sharply reduce economic activity.
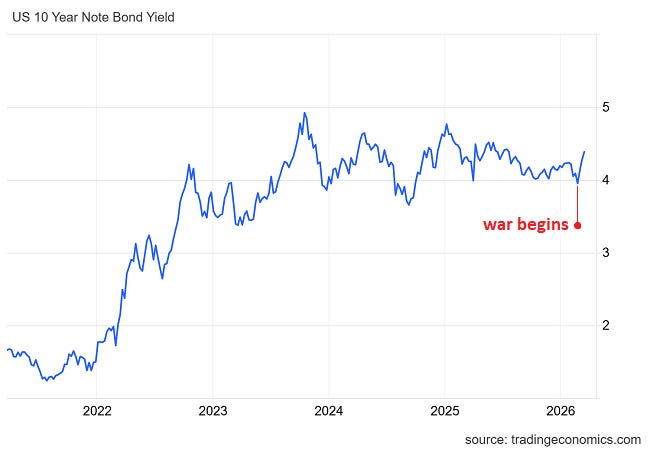
-US treasury yields are already rising sharply since the war began. While it’s not a major move in absolute terms yet, the rate of change is indeed significant. This puts upward pressure on mortgage rates, private credit, and other forms of leverage.
-This puts the Fed in a tough position in terms of setting their short-term interest rates. Shortages of raw materials combined with economic weakness, along with large fiscal deficits is the hardest situation for them to address, because both sides of their dual mandate (maximum employment and stable prices) are simultaneously challenged. It’s stagflationary, in other words. Some Fed officials would likely want to reduce interest rates to address weakness in the labor market, while other Fed officials would likely want to hold rates steady or even raise them to try to combat inflation. (The part that there’d be less debate about, though, is the Fed’s balance sheet. If either the US treasury security market or overnight financing market run into severe liquidity problems, the Fed will provide liquidity regardless of what inflation levels are at the time.)
-And as I mentioned in my prior issue, the US is heavily financialized, with a stock market equal to 200% of the country’s GDP and with a rather concentrated ownership of those stocks. Weakness in the stock market that lasts upwards of a year starts putting very real pressure on executive compensation and high net worth investor capital gains, which then puts very real pressure on federal tax receipts. The tail wags the dog now.
As a result, enough of these occurring together and in sufficient magnitude (as one cascades into the next, starting with sustained high energy prices) could indeed breech up out of the “gradual print” base case and shift us into an actual “big print” later this year.
Current View (Subject to Change)
Do I think that toxic combo will happen this year, enough to cause a huge Fed monetary printing? No, not yet. But certainly the probability of that scenario has increased relative to a month ago.
Back in my September interview when I described the gradual print scenario, one of my first caveats was to put aside major war for the sake of discussion (due to its inherent lack of predictability), and to focus on the baseline financial/economic situation (which is my area of contribution). Well, now we’ve got major war.
Since I’m a financial/tech analyst rather than a political analyst, I’m not in a position to try to predict how a small handful of political leaders will act in the coming weeks. Instead, I will map out the financial landscape as I have in these recent newsletters, and then monitor which aspects (if any) start to come under acute pressure by those political decisions.
Right now, we’re still early in that process, before cascading has occurred too much outside of the war/energy phase.
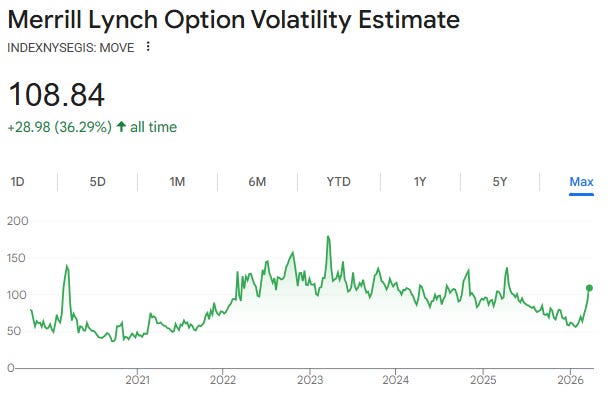
-The MOVE index (a measure of volatility in the US treasury market) is significantly elevated, but not quite at “break” levels:
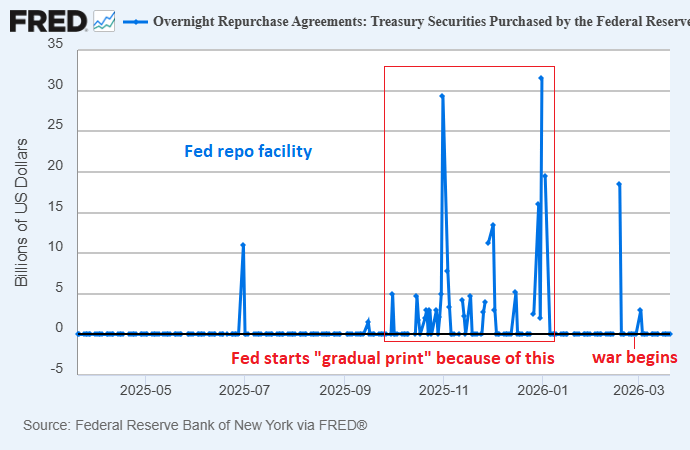
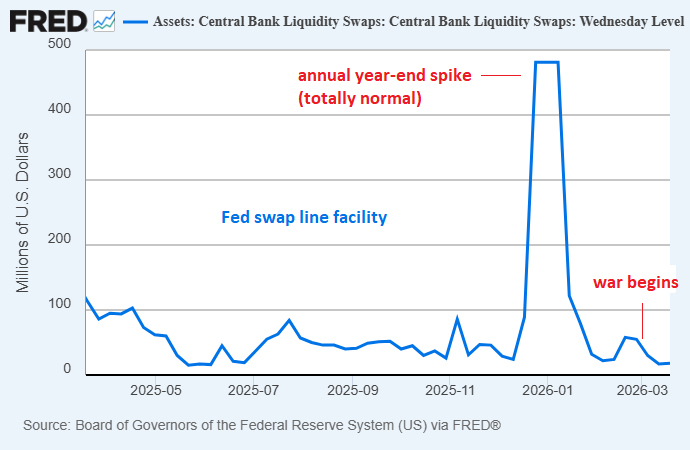
-The Fed has standing repo facilities to help domestic financial institutions when they encounter liquidity shortages, and they have standing swap line facilities to help five allied foreign central banks (BOE, ECB, BOJ, ECB, and SNB) if they run into dollar shortages in their economies. As of this writing, these facilities are not being used to any material degree, which along with other factors demonstrates that dollar shortages in these major economies are not yet acute:
Overall, I continue to hold a “gradual print” outlook, but with uncertainty levels sharply raised with an active war and severe energy disruptions now occurring.
A Flywheel of Chaos
Unfortunately, sovereign debt crises and wars tend to occur in clusters. One tends to lead to the other, in both directions. War is expensive and thus leads to high sovereign debt levels, and high sovereign debt levels can also lead to more severe political decision-making and ultimately, war.
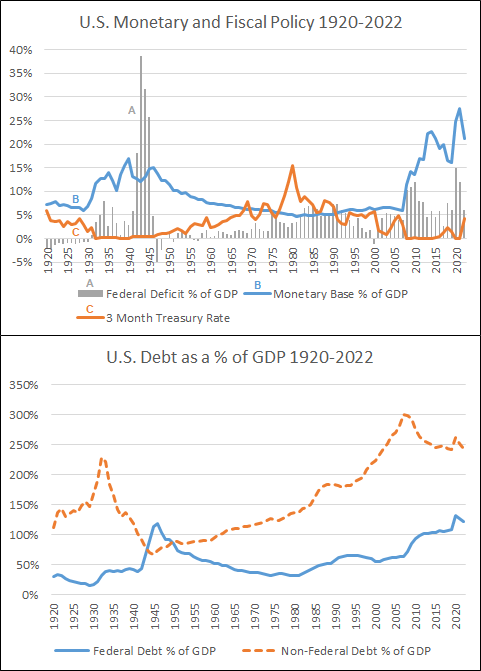
Back in 2020 I wrote one of my foundational articles, A Century of Fiscal and Monetary Policy. In that piece, I highlighted how huge financial imbalances, built over decades, tend to lead to rising levels of populism and outlier political outcomes. The longer imbalances go structurally unaddressed, the more things simmer and risk coming out in ways that aren’t necessarily productive.
In multiple newsletters, articles, and in chapter 19 of Broken Money, I covered the topic of the long-term debt cycle. In summary, debt tends to build up over multiple credit cycles in the private sector, until it reaches its absolute limits. At that point, rather than mass defaults occurring, money usually gets printed and the debt starts to get rotated up onto the sovereign level via much larger fiscal deficits. Then, when debt builds up significantly on the sovereign level, the next release valve is through inflationary currency debasement and major political resets.
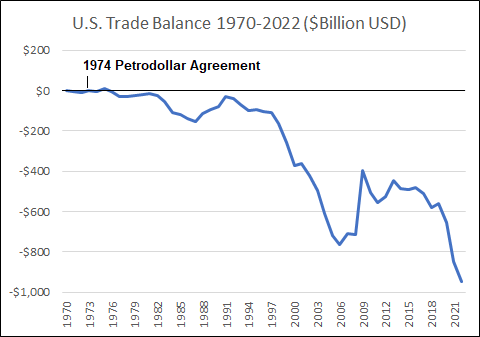
Similarly, as I highlighted in chapter 13 of Broken Money, wielding the global reserve currency comes with significant and ever-growing imbalances for capital flows and trade (often known as the Triffin dilemma). That’s basically the growing cost, the dwindling fuel, of maintaining such a dominant ledger for the world to use. And when the system becomes greatly imbalanced, it’s not that it necessarily breaks suddenly, its that the costs of maintaining the status quo exceed the benefits in aggregate, and so populism, resentment, and economic stagnation tend to start rising within that reserve currency country.
A nation state does not normally “go gentle into the good night” during these periods, especially if they’re the incumbent power. Empires don’t voluntarily downsize. Instead, they tend to take the mask off, lash out, and aggressively seek other places to offload those problems. In other words they “rage, rage against the dying of the light.”
However, normally the core problems are too structural to just offload to others, and thus those problems keep coming back to hit at home until a true crisis and a more significant realignment occurs.
I don’t think we’re there yet. This is a process that can take many years to play out. But we’re in that type of environment, where the US is encumbered by both fiscal dominance and the Triffin Dilemma, and thus needs structural reforms. And so the state becomes a bigger force in domestic and global affairs, as it seeks to protect itself, but is unable or unwilling as of yet to tackle the core issues. And that’s in part because voters don’t want to tackle the core issues either.
What all of this points to is that US fiscal deficits will continue to run hot for the foreseeable future. Nothing stops this train, and a handful of things, such as major war, can potentially accelerate it.
The Investment Implications of Chaos
I continue to be a long-term bull on scarce and high-quality assets that trade for reasonable valuations.
Overvalued equities (like certain defensive stocks) and high-sentiment pricing (as gold and silver encountered recently, or bitcoin encountered last year) can put temporary negative pressure on otherwise good assets (let’s call them group A).
On the other hand, major supply growth (like currency and bonds) make for inherently weak assets (let’s call them group B) that are risky over the long run to have too much exposure to.
Thus, I continue to emphasize group A, and within that group try to lean in toward assets that are under-owned and not very expensive, with gradual rebalancing over time away from over-owned assets. Within Group B, to the extent that I have exposure to currency or bonds, I prefer assets that are closer to the currency side of that spectrum (such as cash or short-term bills/notes), since those assets are at least useful as a volatility shock absorber for crisis moments like we’re currently in.
Summarizing that strategy, I continue to use what I refer to as a three pillar portfolio:
I have been recommending what I have called the “three pillar portfolio” during this period of fiscal dominance. It has been a cornerstone concept of how I have been investing in the macro sense. For me, the three main pillars consist of 1) profitable equities 2) commodities/producers and hard monies and 3) cash-equivalents.
Profitable equities do the best when there is a period of disinflationary economic growth. Commodities and their producers do the best when there is a period of inflation or stagflation. Cash-equivalents hold up well during disinflationary credit contractions, when almost everything else is falling relative to society’s unit of account that most debts are denominated in.
-April 2024 newsletter
A typical 60/40 stock/bond portfolio underweights the commodities/producers and hard monies category, and thus relies mainly on disinflationary conditions with abundant raw materials to do well. Stocks do well during disinflationary growth, bonds do well during disinflationary contractions, but the portfolio has no answer for stagflationary conditions with shortages in energy and raw materials.
That’s why it’s useful to have some commodities/producers and hard monies as well, and over a sufficiently long period of time (and with appropriate position sizes) that pillar historically boosts the Sharpe ratio of the overall portfolio relative to a 60/40 strategy.
Portfolio Updates
I have several investment accounts, and I provide updates on my asset allocation and investment selections for some of the portfolios in each newsletter issue every six weeks.
These portfolios include the model portfolio account specifically for this newsletter and my relatively passive indexed retirement account. Members of my premium research service also have access to three additional model portfolios and my other holdings, with more frequent updates.