

The CME Comex is the Exchange where futures are traded for gold, silver, and other commodities. The CME also allows futures buyers to turn their contracts into physical metal through delivery. You can find more detail on the CME here (e.g., vault types, major/minor months, delivery explanation, historical data, etc.).
The data below looks at contract delivery where the ownership of physical metal changes hands within CME vaults. It also shows data that details the movement of metal in and out of CME vaults. It is very possible that if there is a run on the dollar, and a flight into gold, this is the data that will show early warning signs.
Gold
We have been tracking this data for years now. Since January of 2025, the market has seen elevated delivery volume far surpassing what had been seen in years past. Then, suddenly activity just stopped. This was the case last month too (which is a major month in gold). Delivery volume this month was half what we had seen in the quietest month since 2024.
It wasn’t a gradual slowdown, it was sudden. As if all of a sudden demand just vanished.
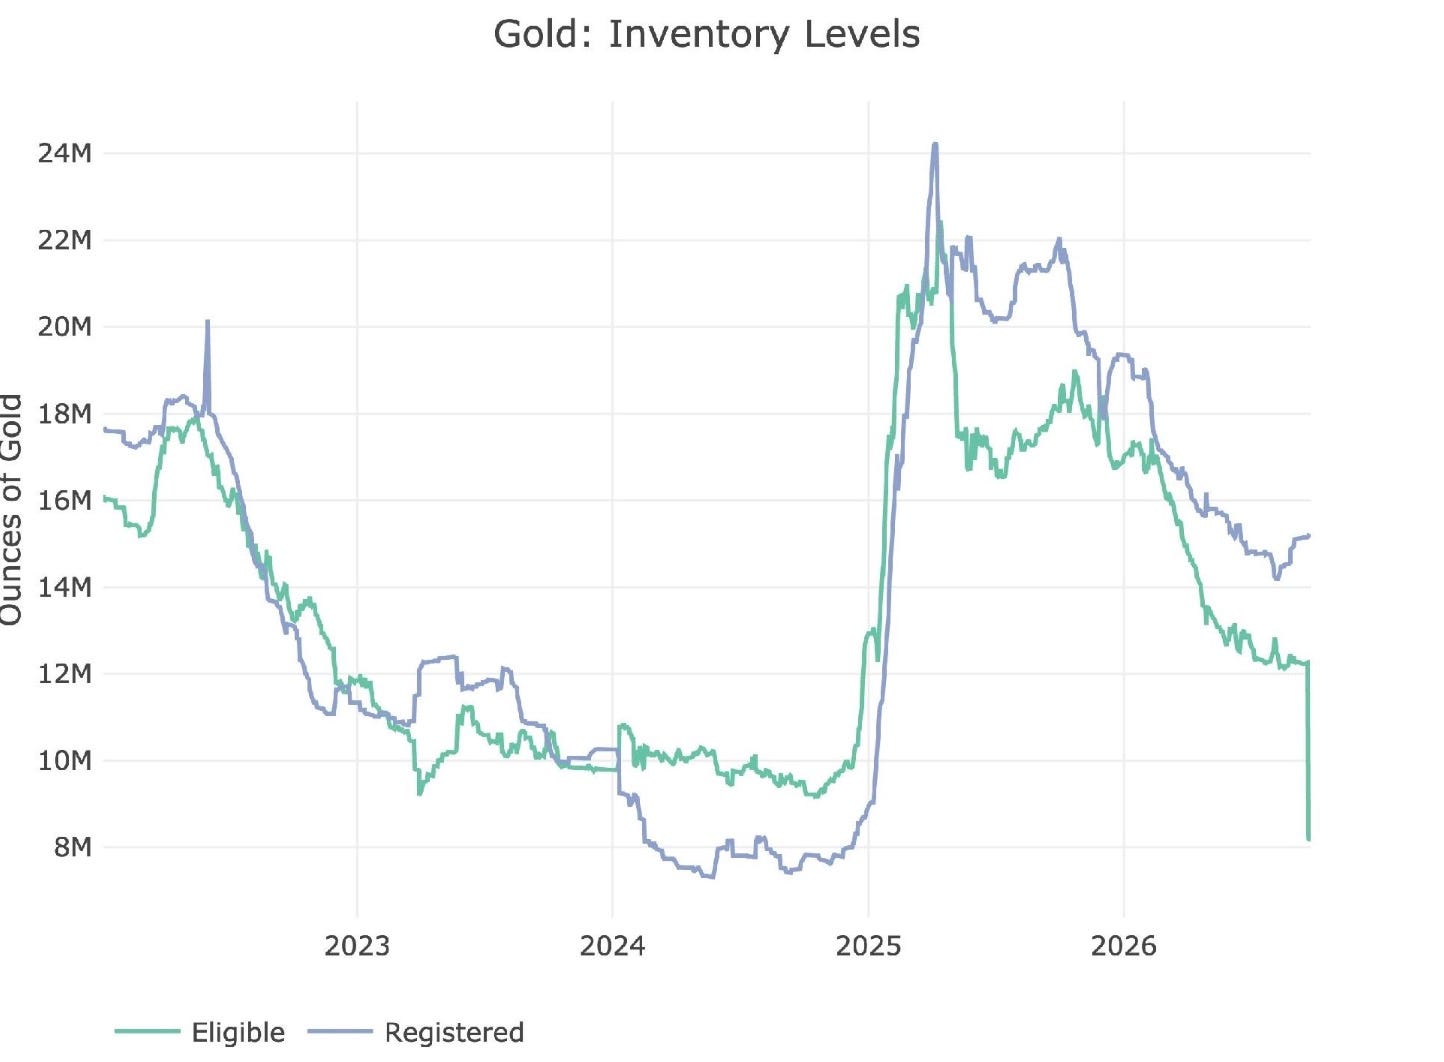
Figure: 1 Recent like-month delivery volume
When looked at from a dollar amount perspective (rather than raw ounces), you can see that this September is larger than 2023 and 2024, but that is mostly attributable to the price gain. Otherwise, the amounts would be the same. Compared to 2022 it is way less in terms of ounces.
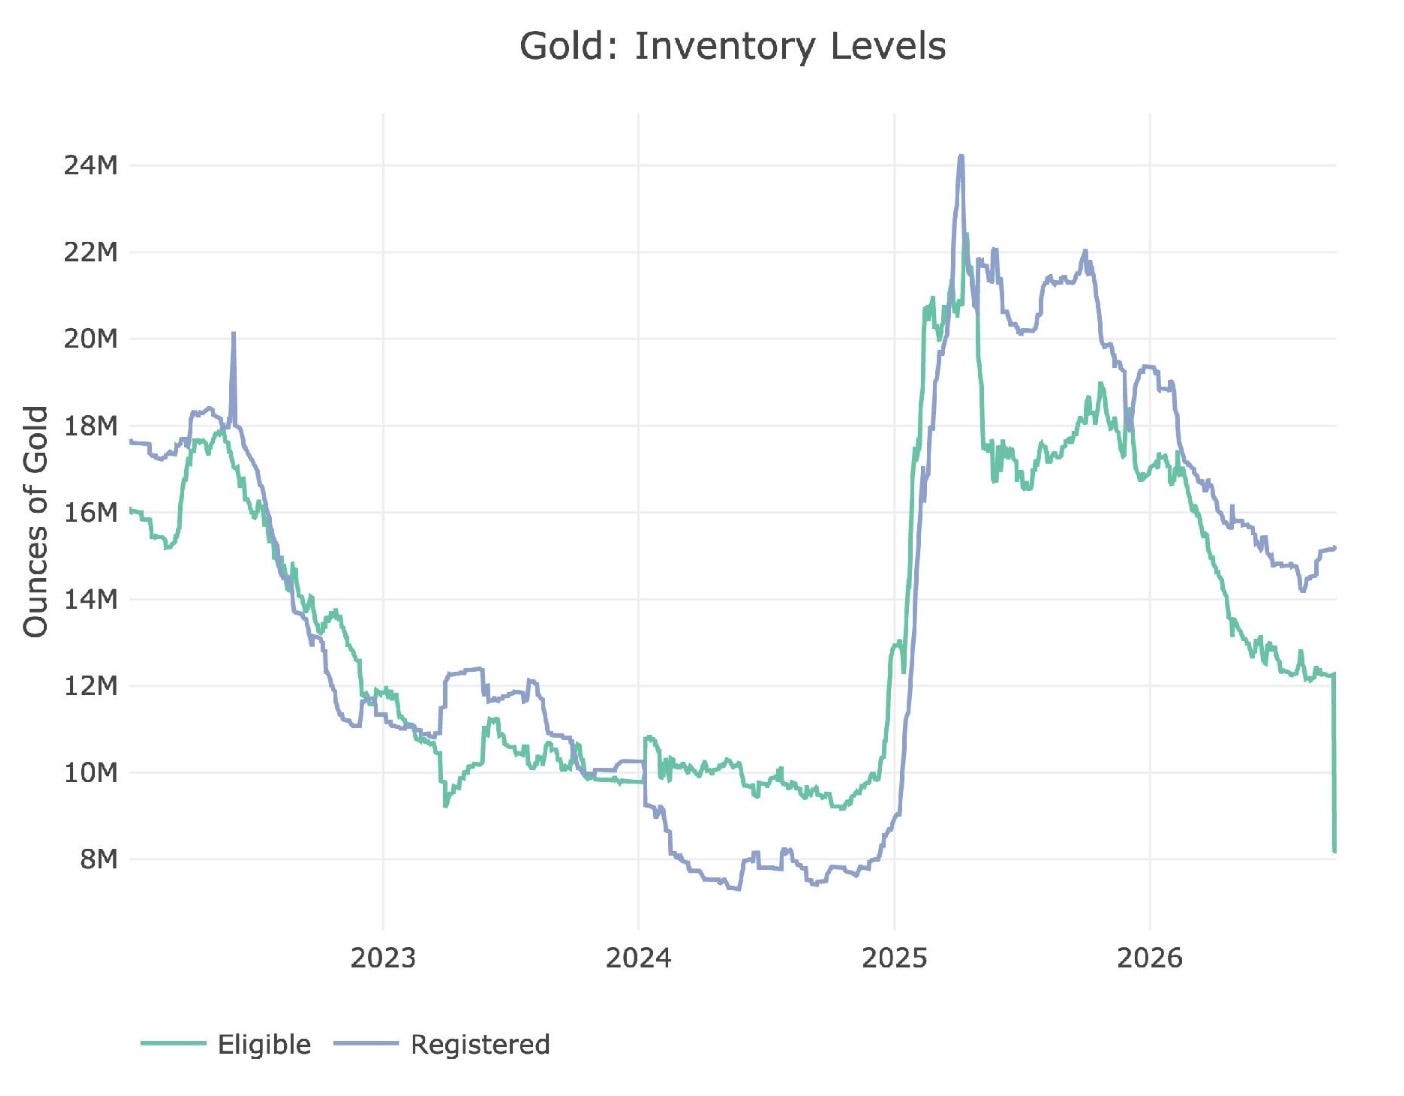
Figure: 2 Notional Deliveries
Net new contracts (contracts that open and settle for immediate delivery) are at the lowest level in two years.
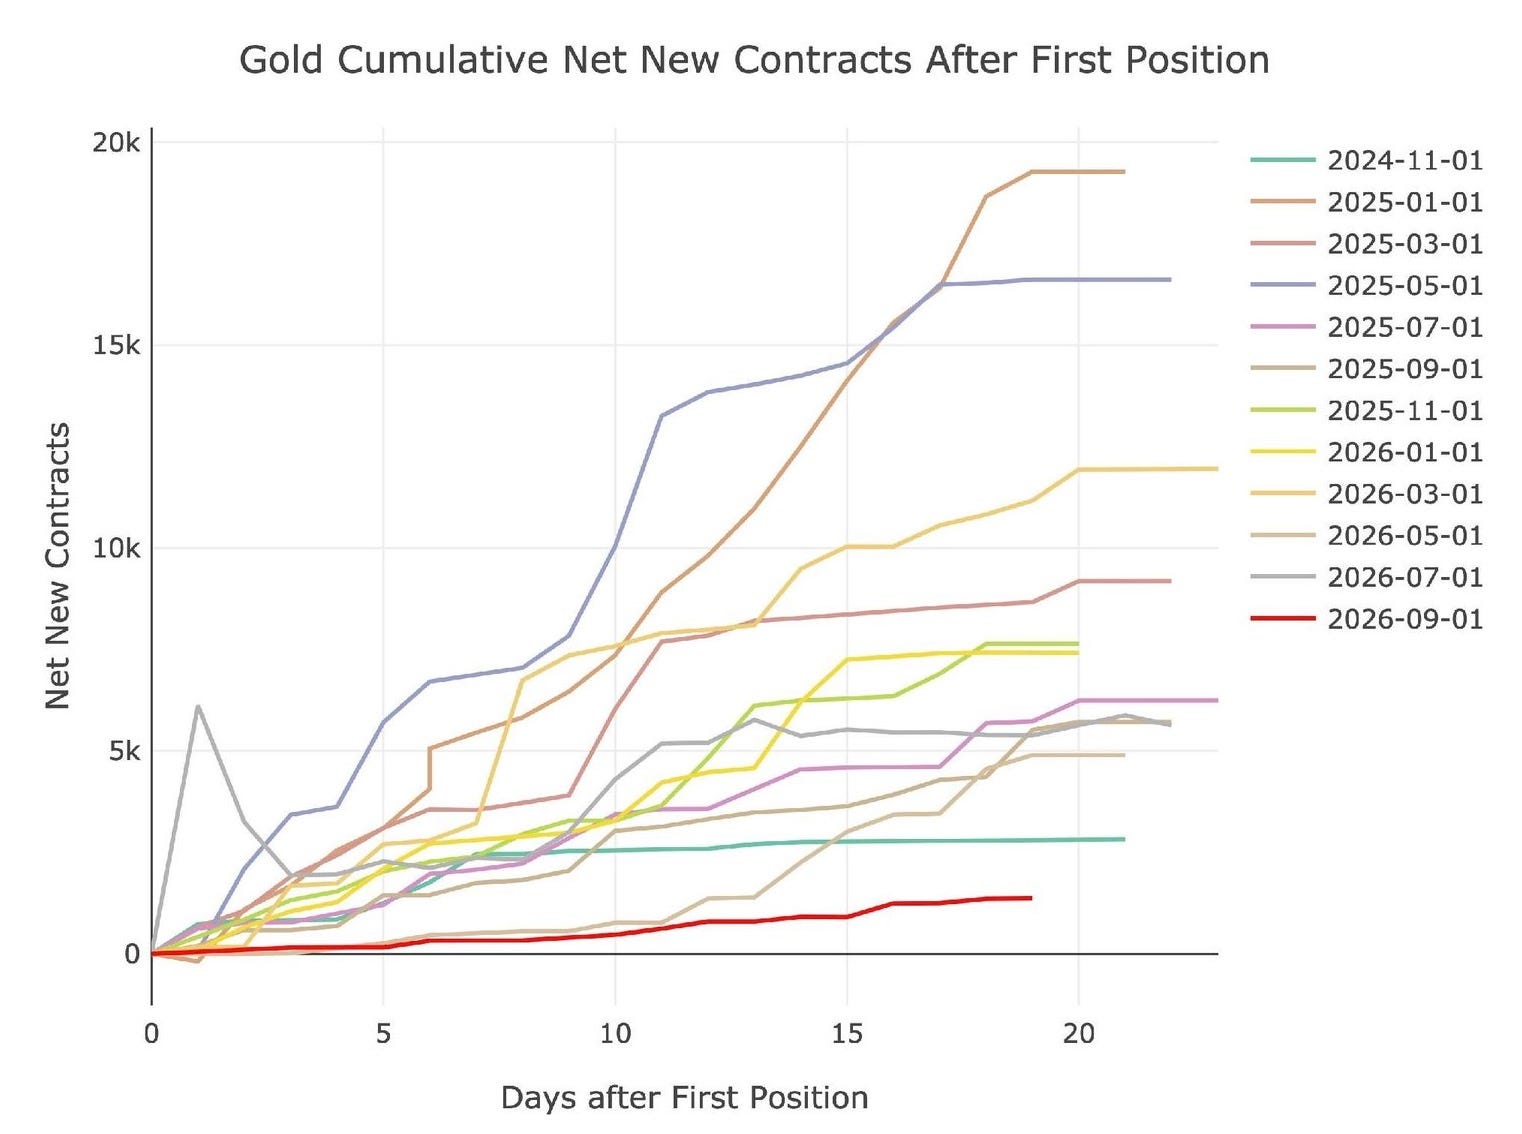
Figure: 3 Cumulative Net New Contracts
Here is the more interesting chart of the group. During the gold delivery surge that occurred in 2020, the Comex needed to add metal fast. To accomplish this, they opened up a 400-ounce contract and brought on vaults holding 400-ounce bars which are the London LBMA standard. This was done to give confidence to the market in a period of stress.
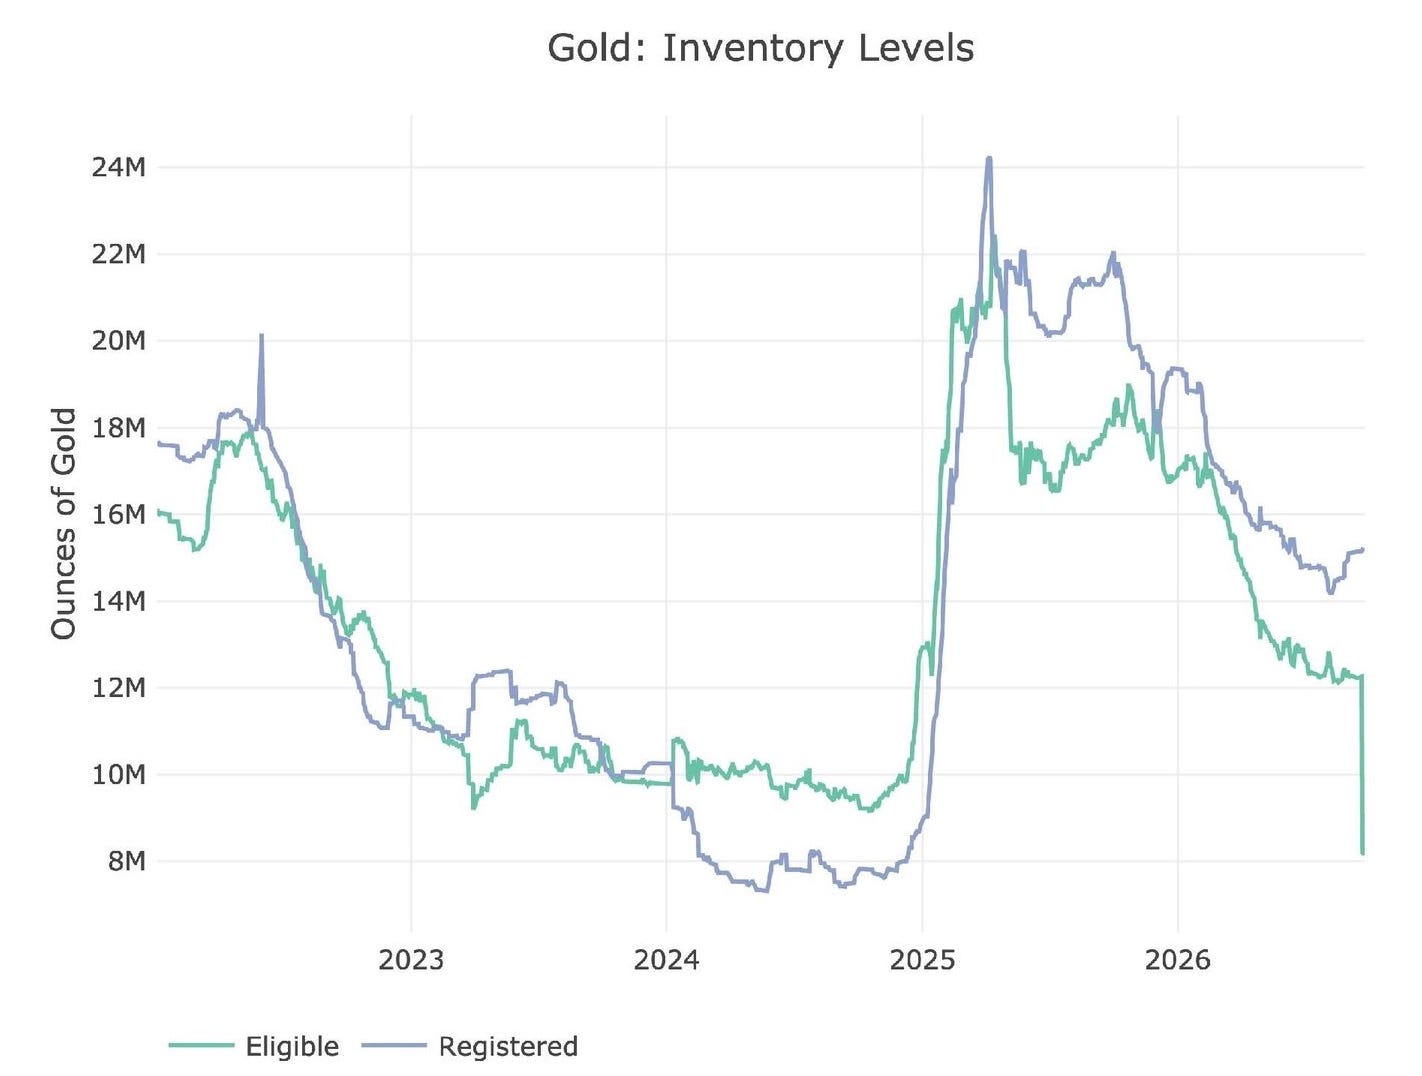
Figure: 4 Inventory Data
Looking ahead to the October delivery period (a mid-level month for gold), we see a contract that is well below average, near the bottom of the range as the roll date approaches.
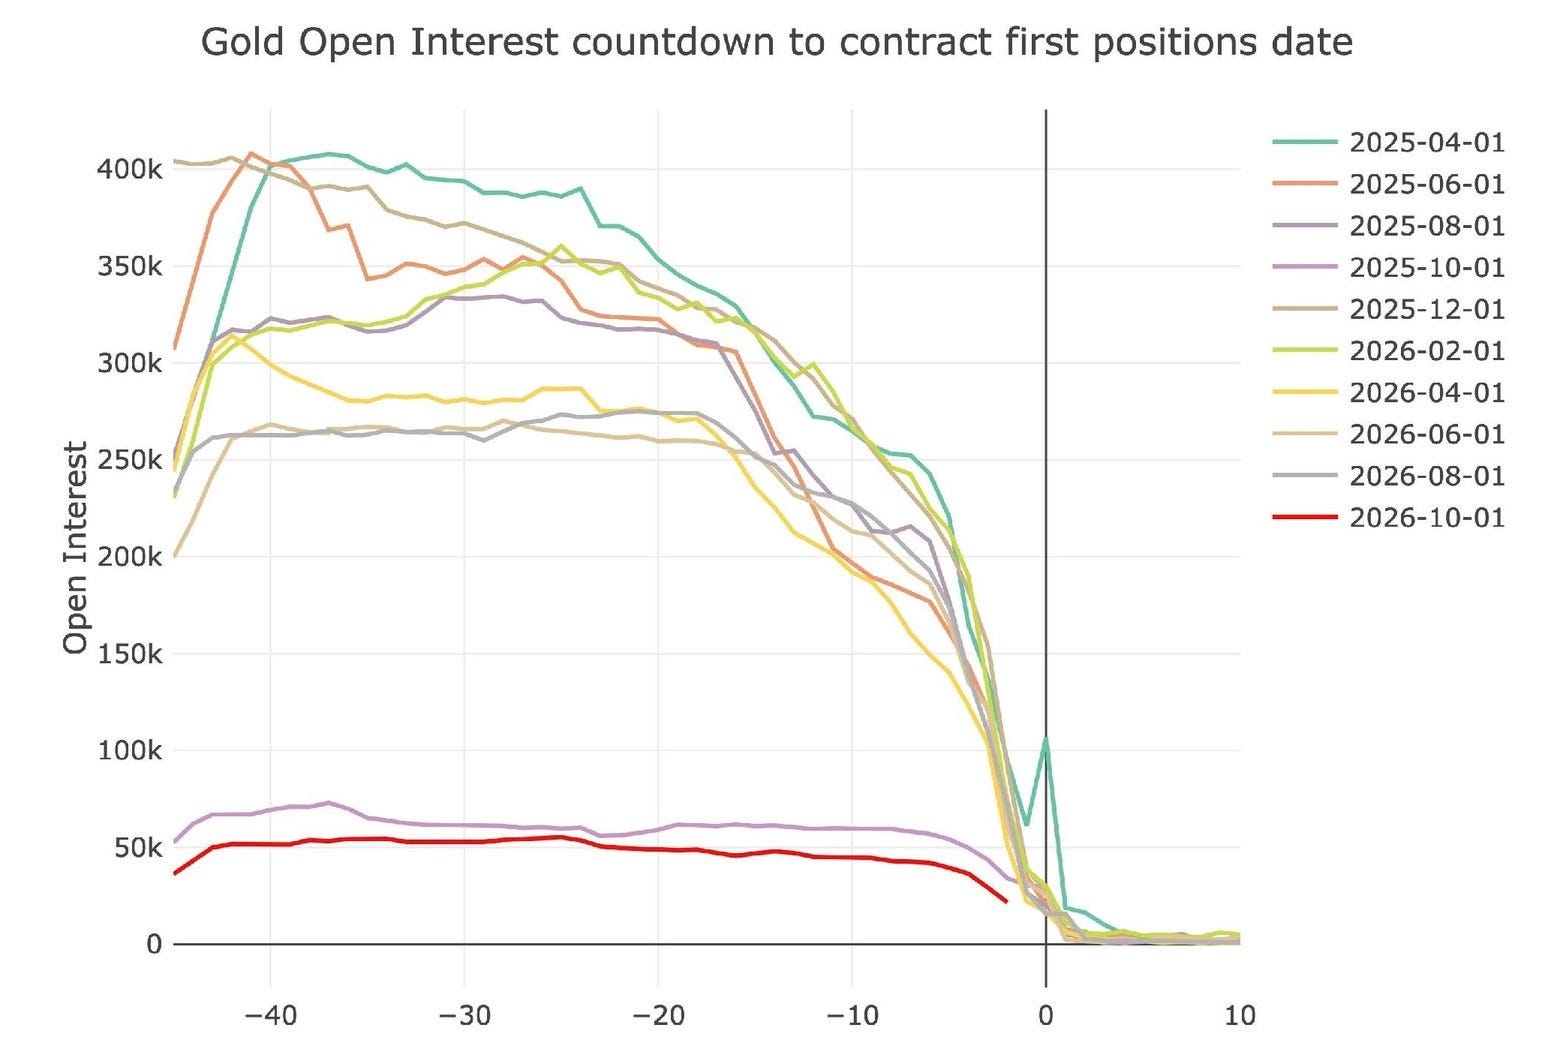
Figure: 5 Open Interest Countdown
Even on a relative basis, the demand is looking rather weak.
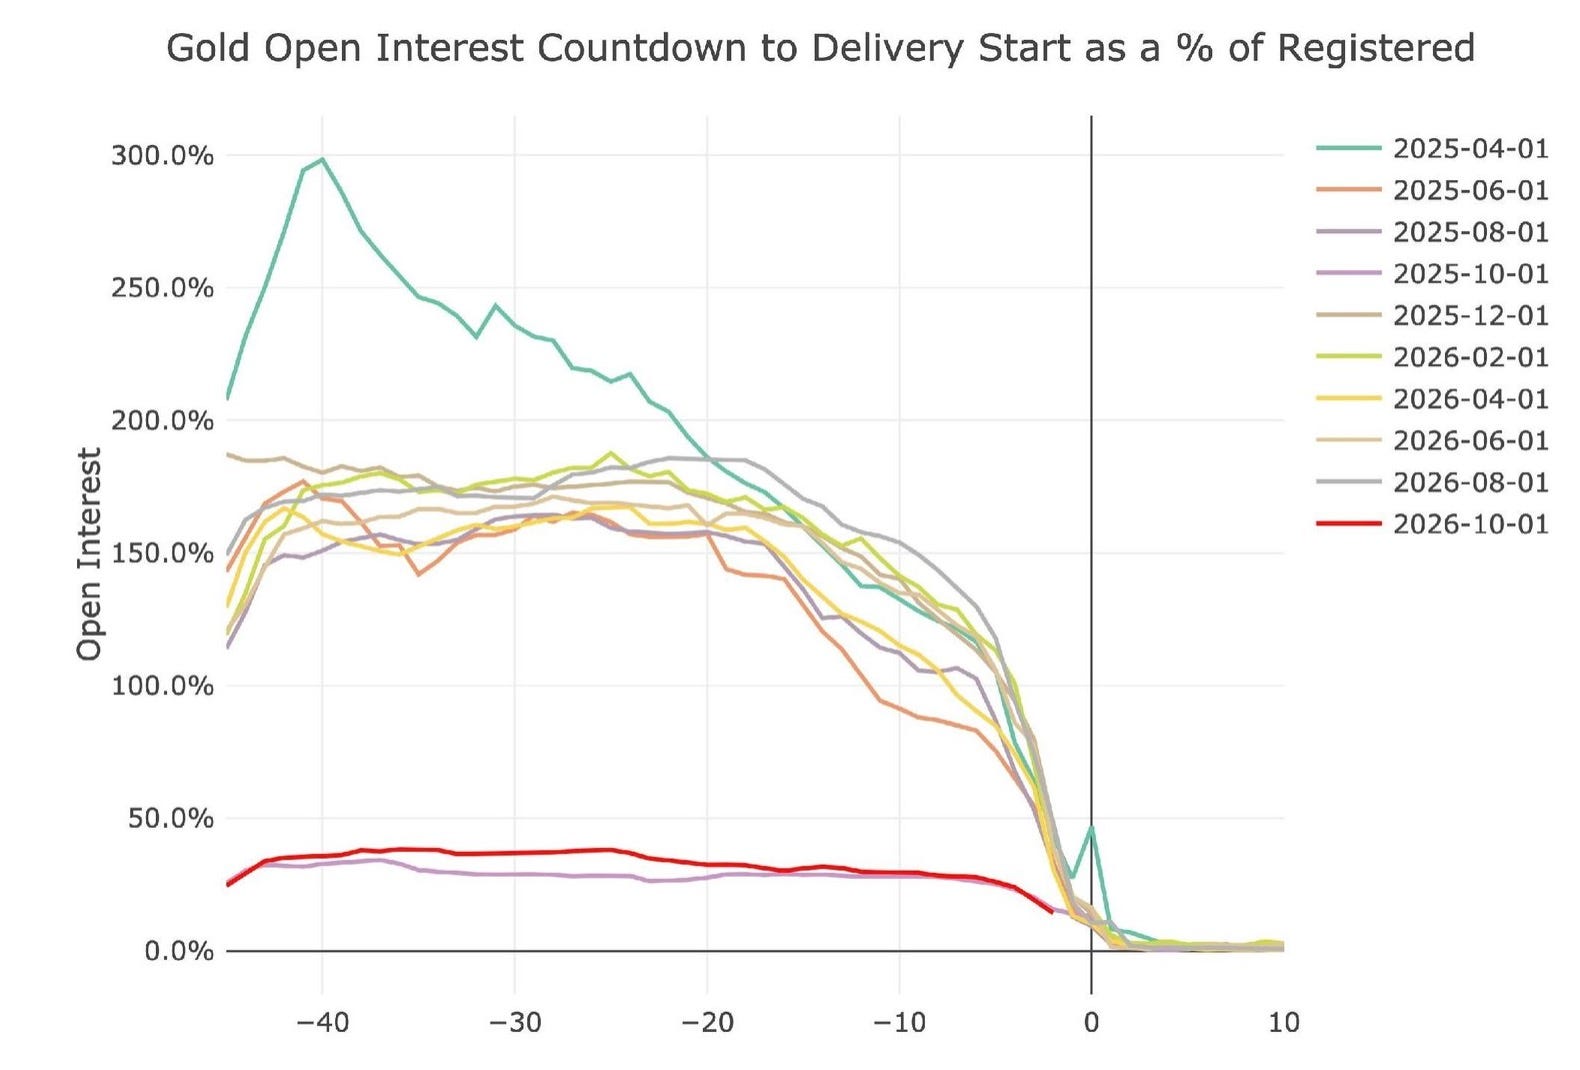
Figure: 6 Open Interest Countdown Percent
Bottom line, delivery volumes have fallen and the exodus of gold from Comex vaults has paused. The massive outflow seen this month is a simple change to the Comex inventory process and not an actual drop in physical metal inventories.
Silver
Silver price spreads have inverted again, albeit only for a short period so far.
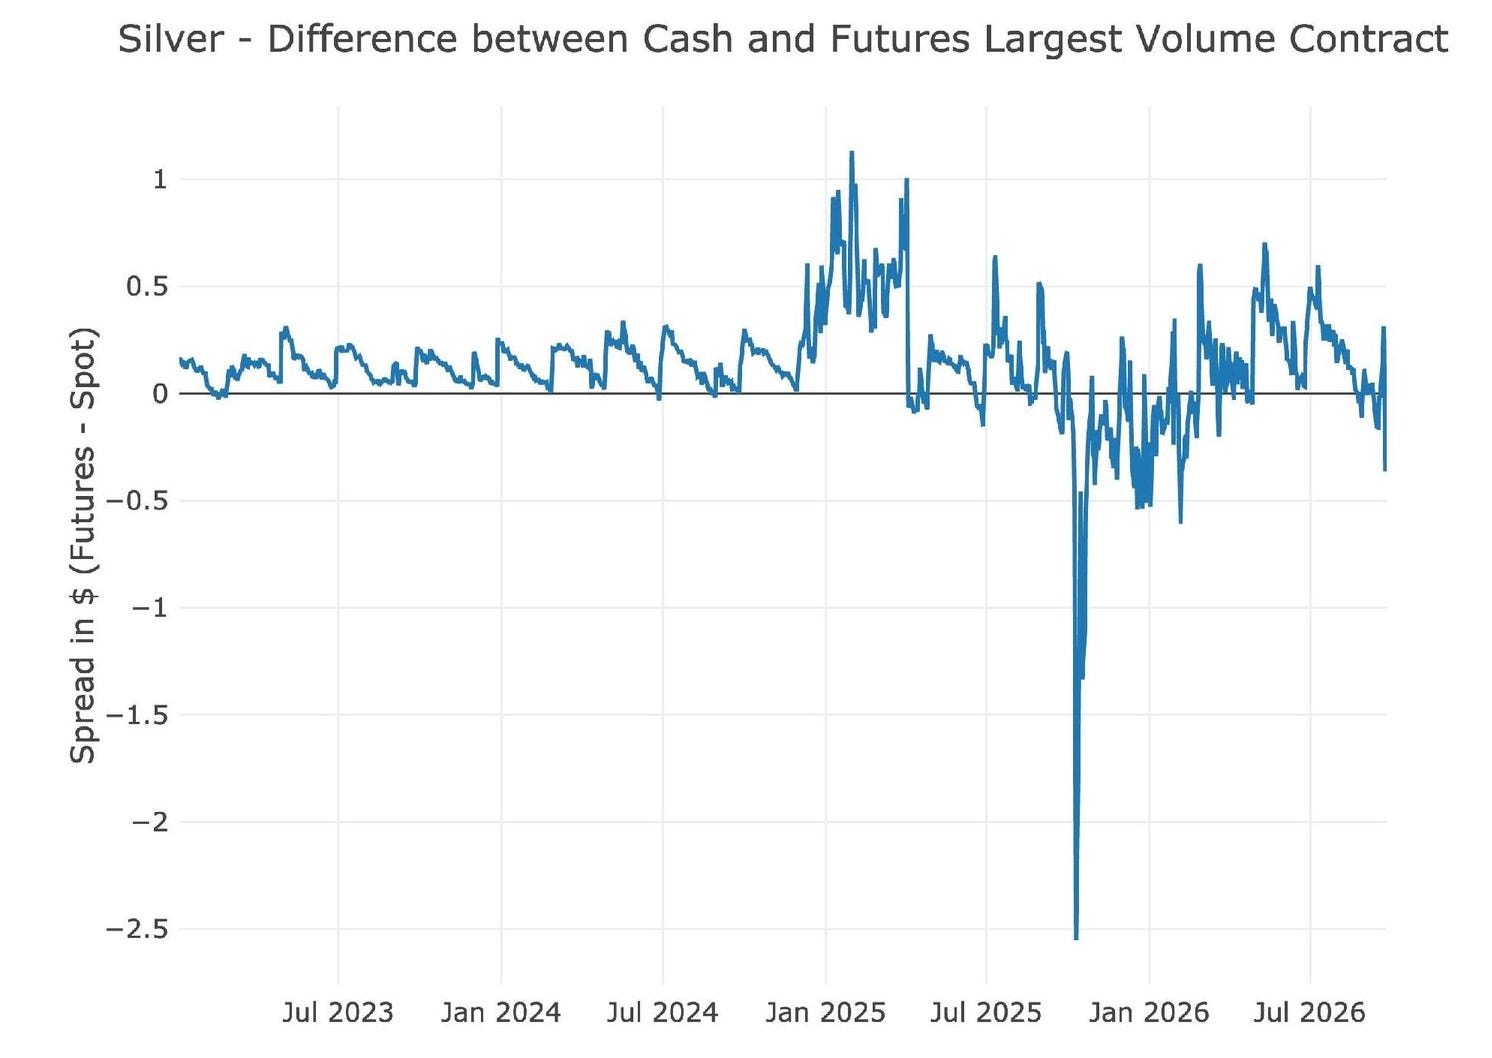
Figure: 7 Spot vs Futures
Silver delivery volumes have also dropped, but not as severely as gold.
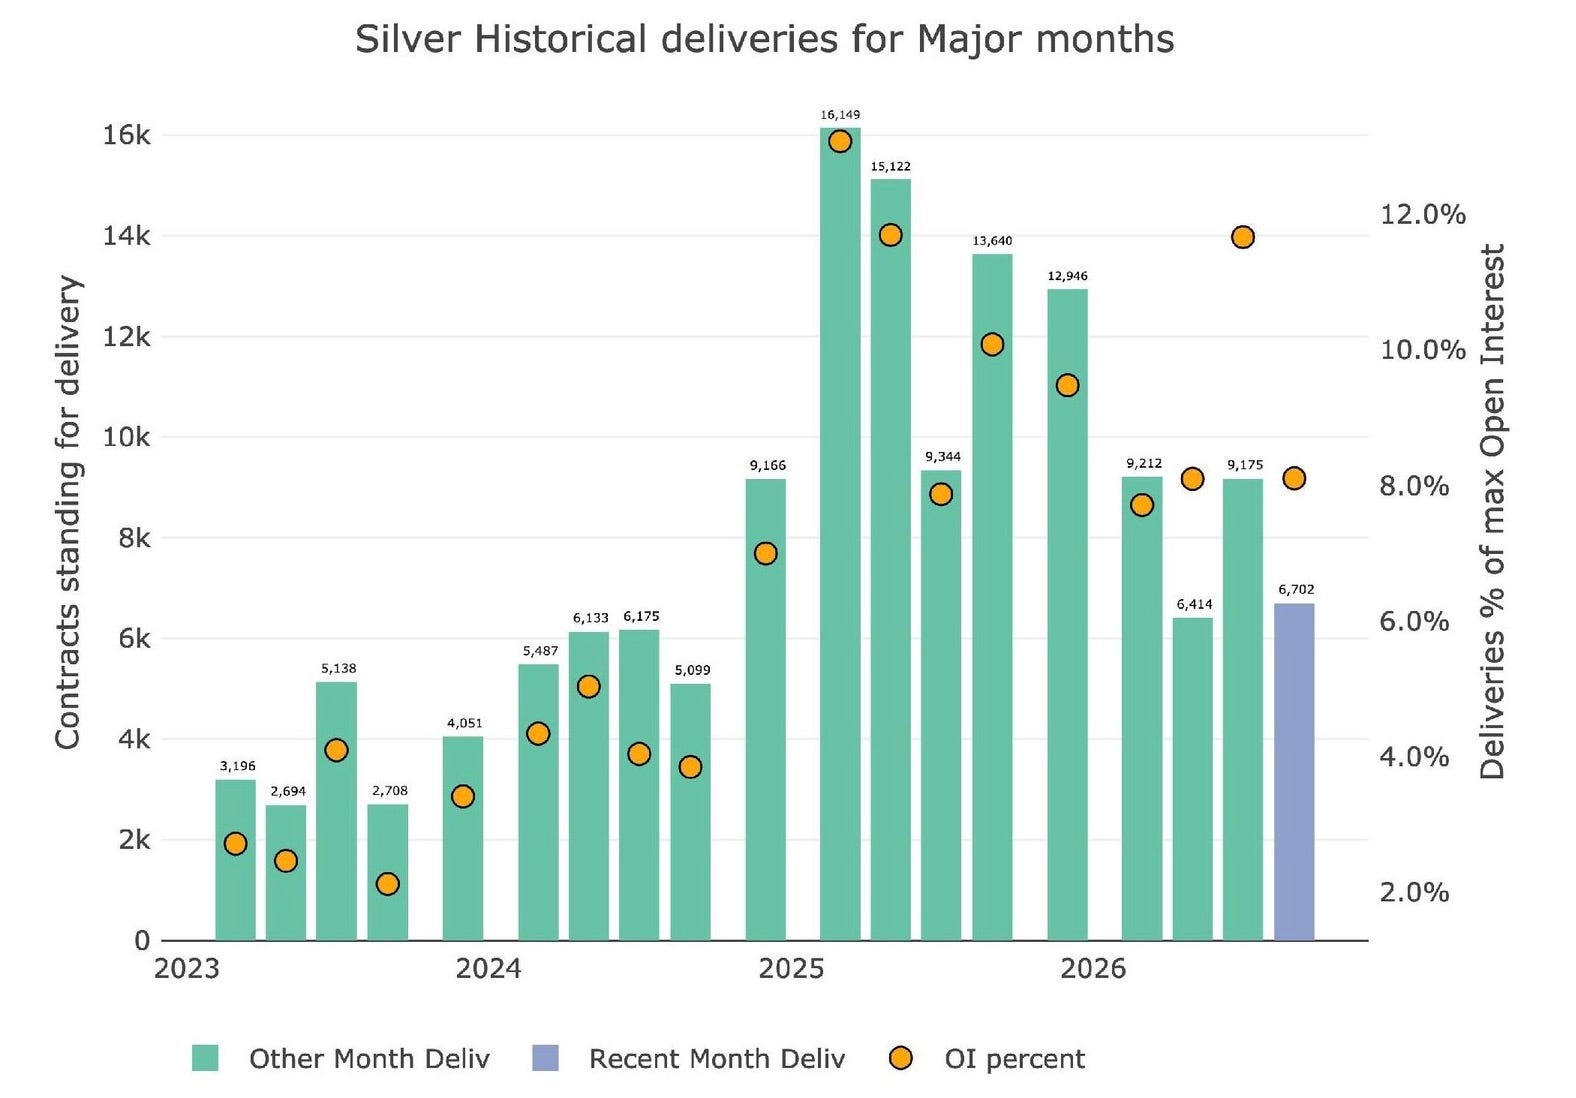
Figure: 8 Recent like-month delivery volume
Notional delivery volume is still very high in silver but this is mostly due to the price increase in silver.
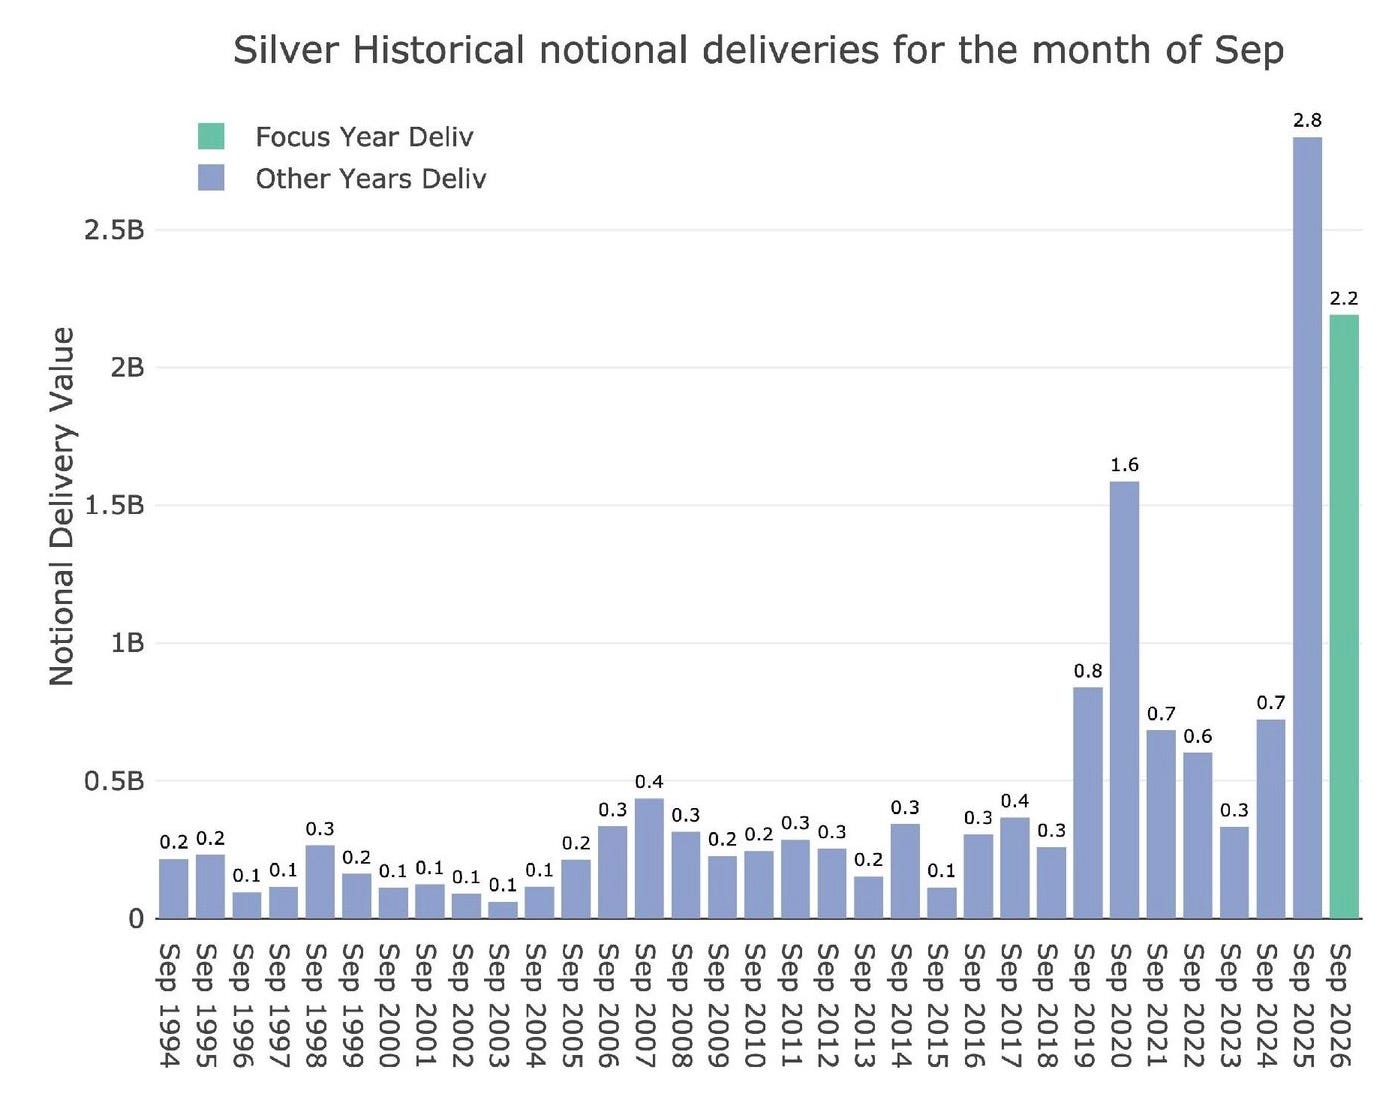
Figure: 9 Notional Deliveries
Silver net new contracts were middle of the pack this month after they were non-existent last month.
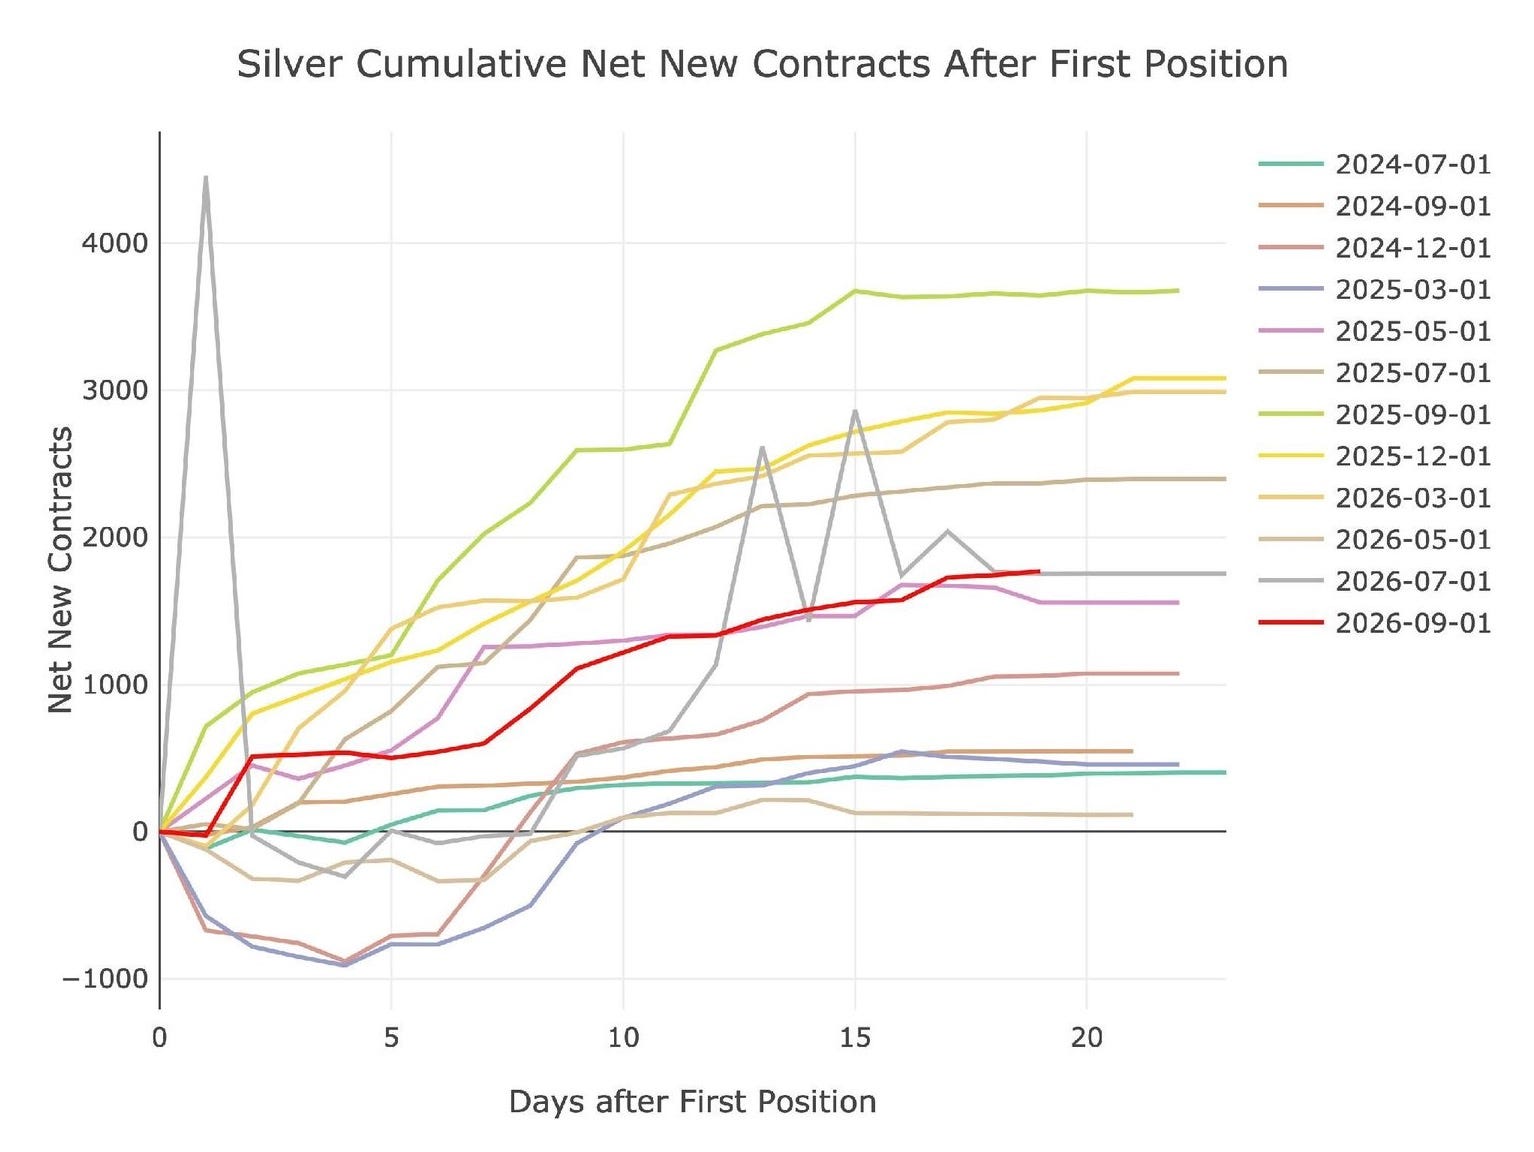
Figure: 10 Cumulative Net New Contracts
Silver inventory has been on a bit of a roller coaster. After a big drawdown in 2025 and early 2026, the exodus stopped on a dime. Then there was metal added back in but the most recent move has been another exit.
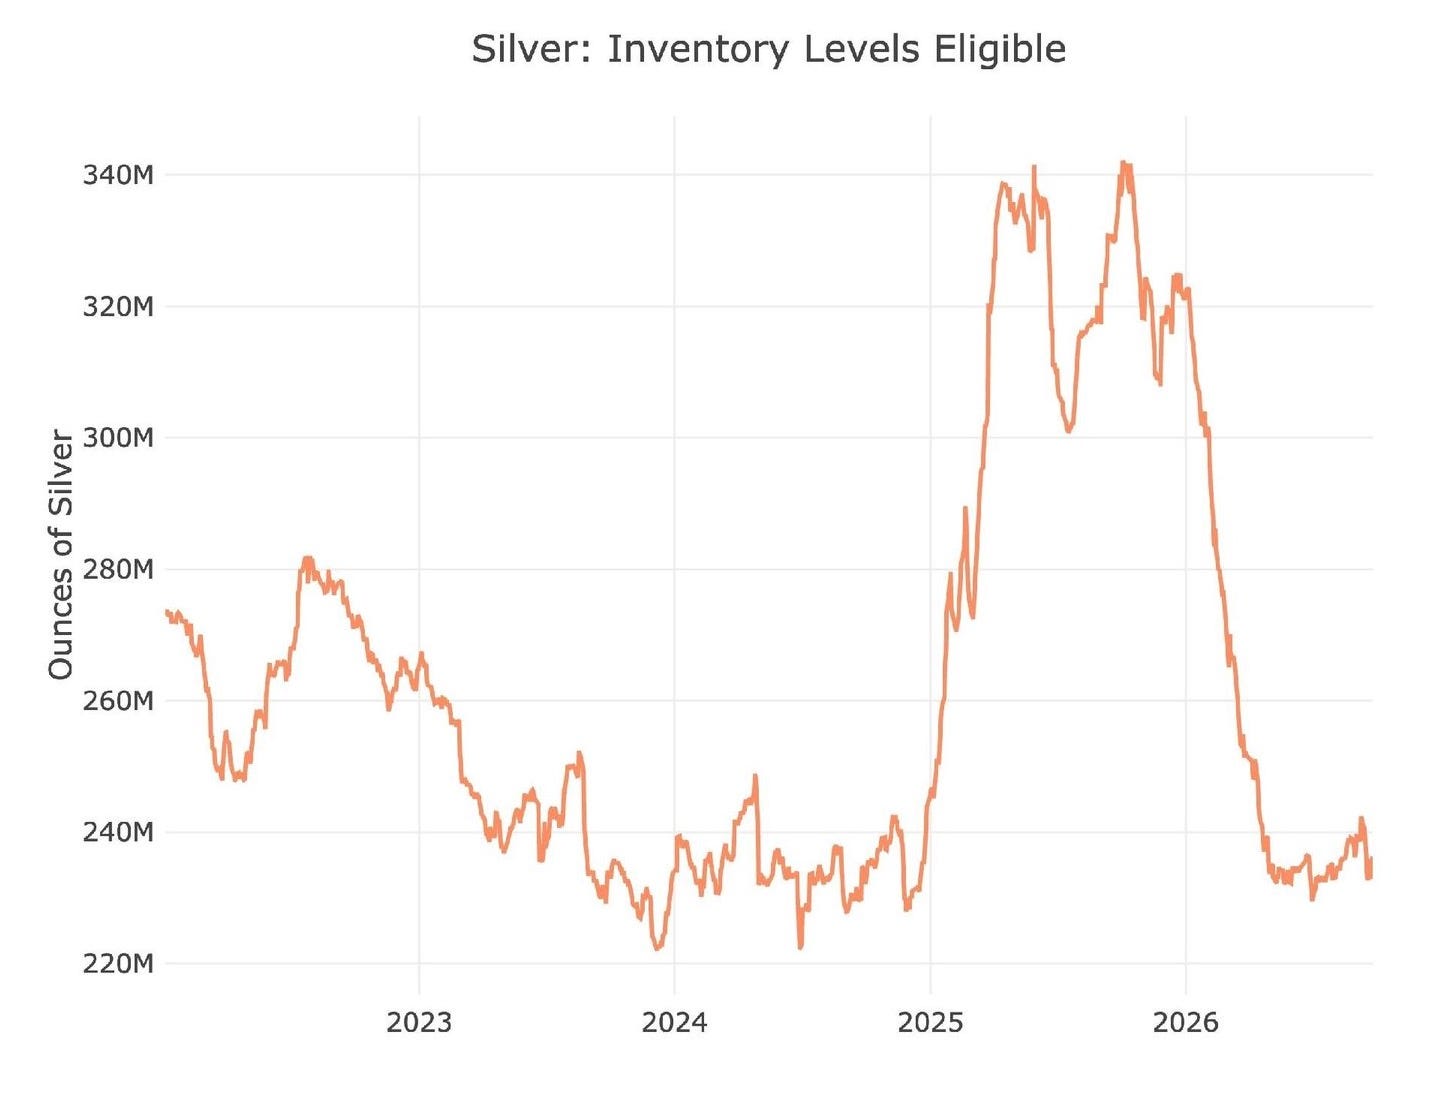
Figure: 11 Inventory Data
Registered metal shows the same thing as Eligible, an increase over several weeks followed by a recent down move.
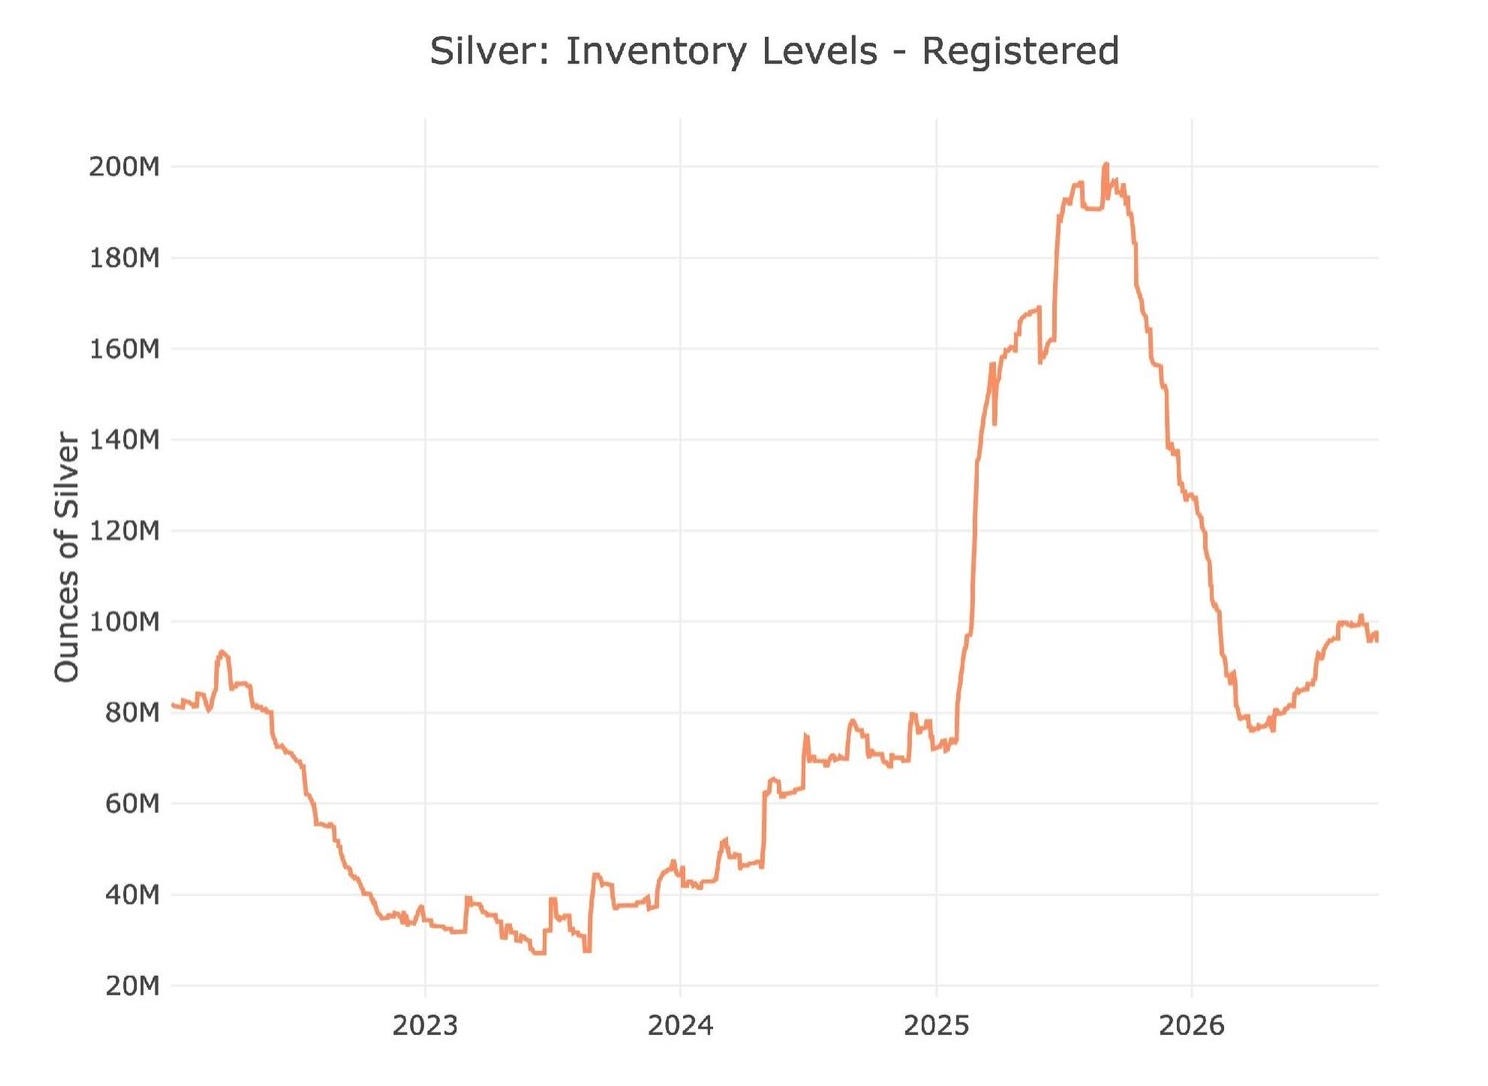
Figure: 12 Inventory Data
As we approach October delivery (minor silver month), the silver contract is actually quite strong.
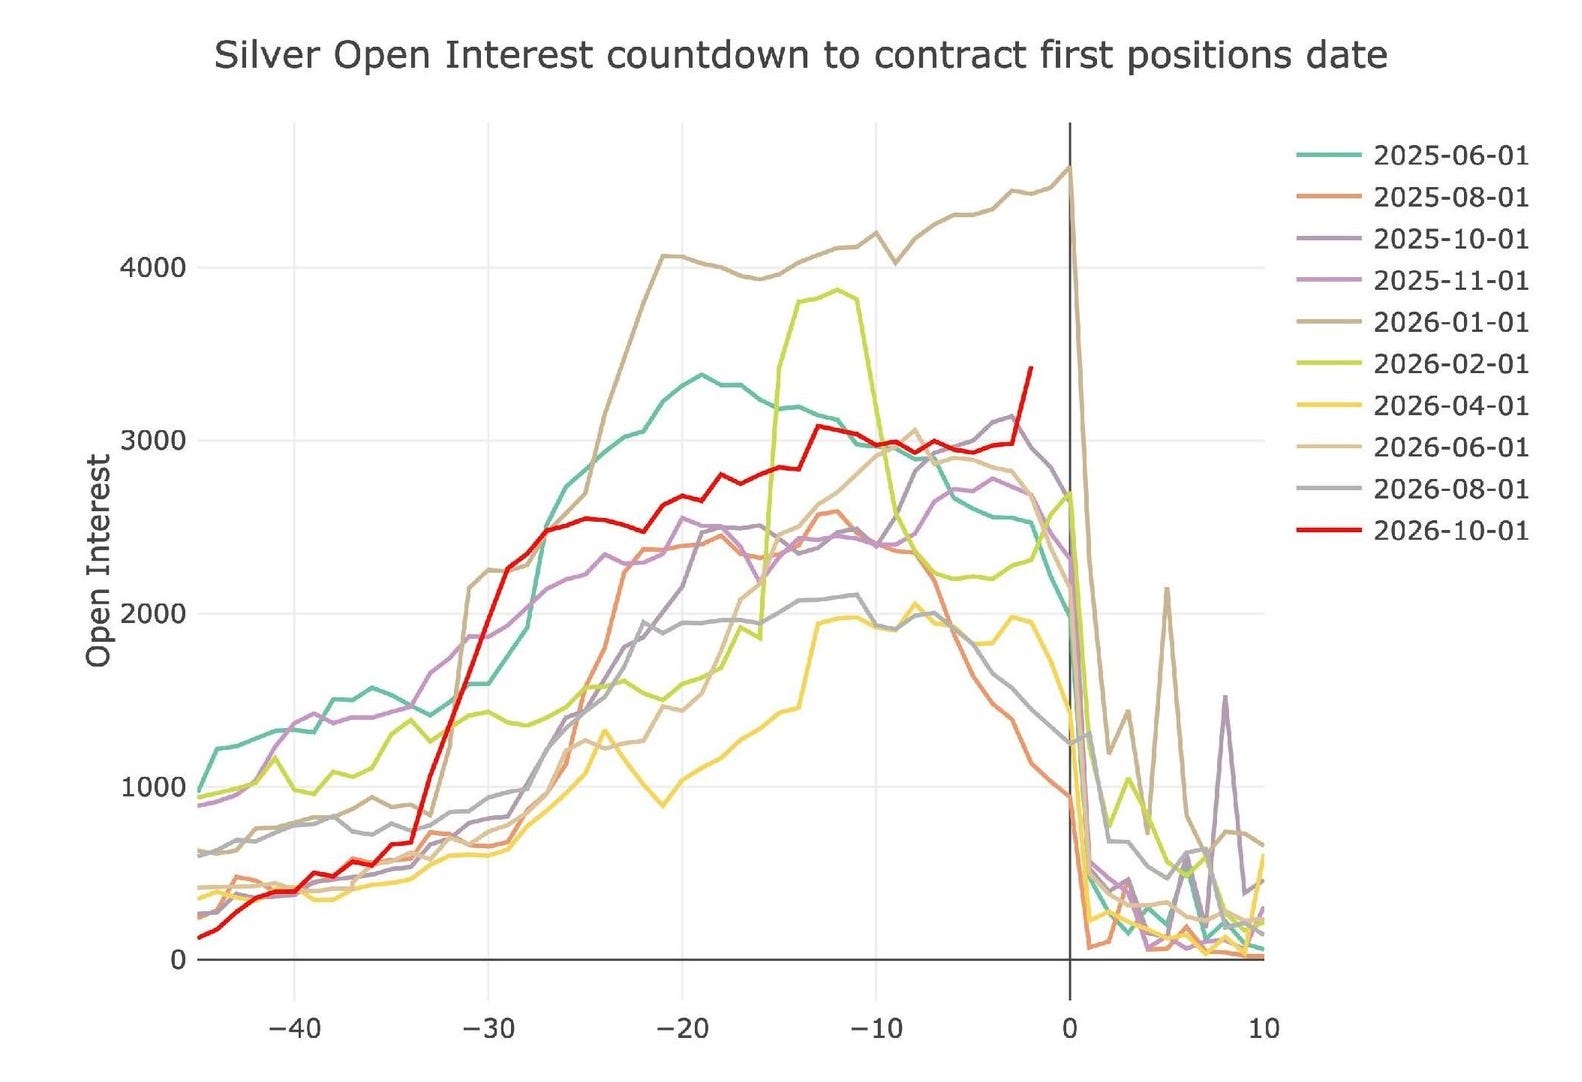
Figure: 13 Open Interest Countdown
On a relative basis, it’s the highest in recent periods.
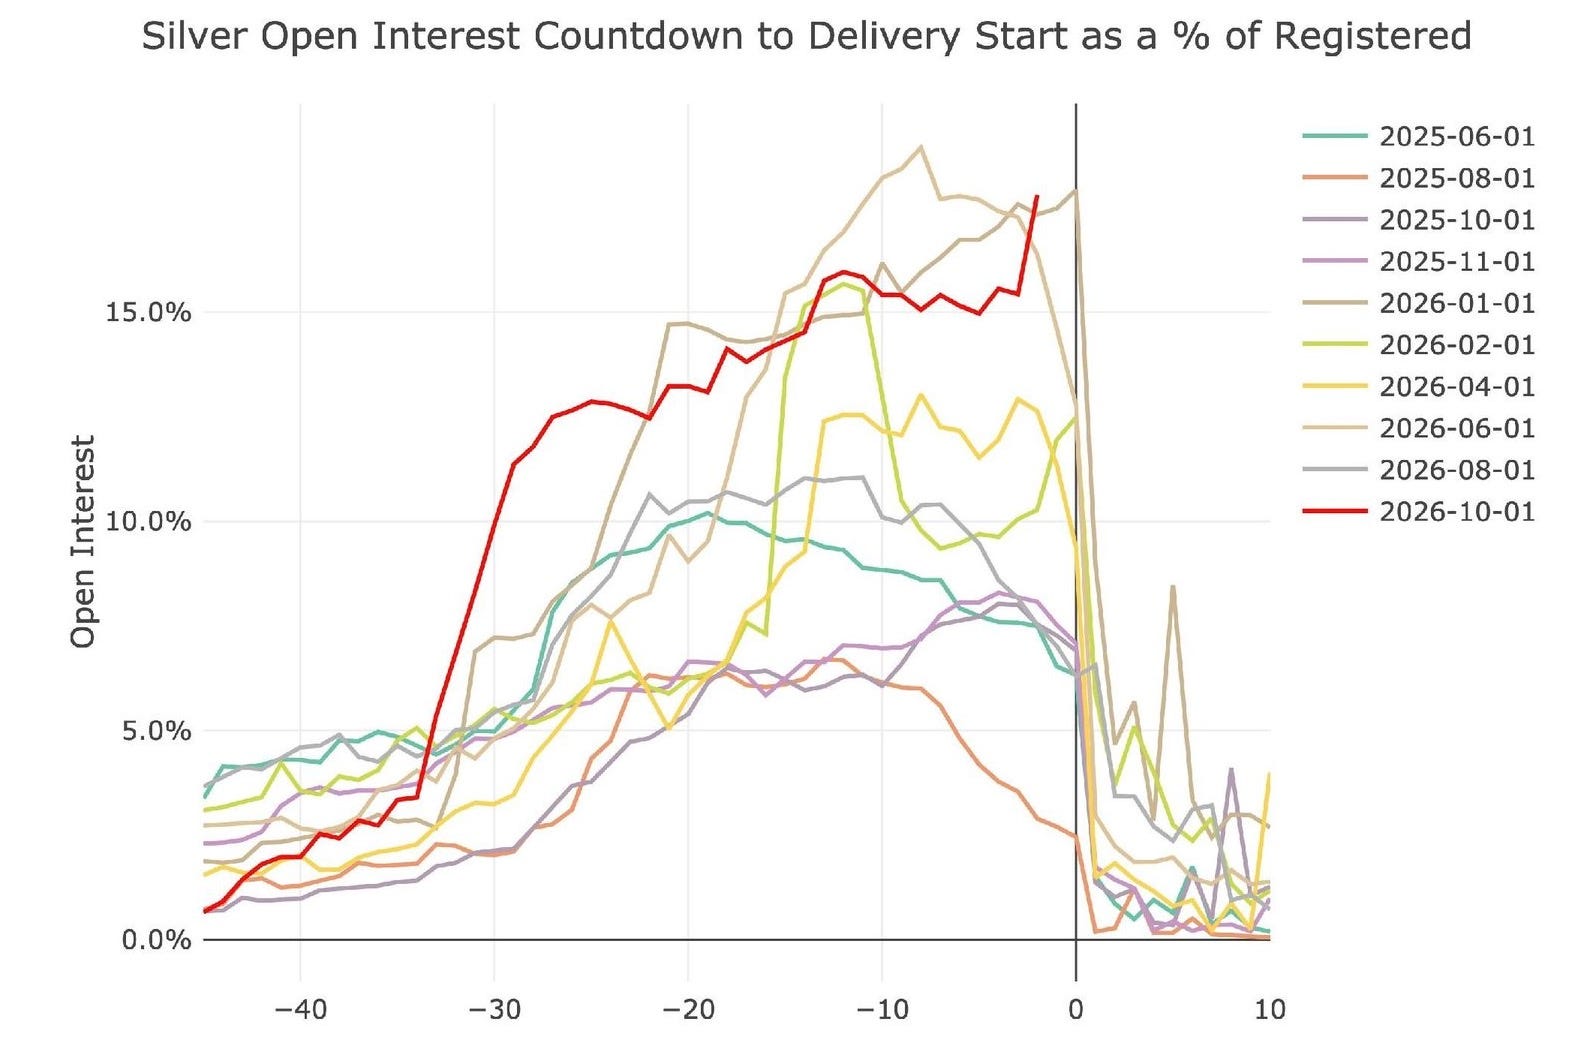
Figure: 14 Open Interest Countdown Percent
Conclusion
The Comex data is where the run on physical metals has been occurring over the last few years. Right now, data shows that demand for gold has evaporated where demand for silver has firmed. The removal of the 400-ounce bars from the inventory tells you something else though. When the market was stretched, the Comex did whatever they could to give the appearance of calm. With the 400 ounce now cancelled, if inventory were to come under pressure again, the Comex may find their vaults getting drained quite quickly.
The immediate and sudden collapse in physical demand for gold is something worth watching, especially since the same thing is not playing out in silver. It will be interesting to see how this plays out. It might be that the new Asian markets are attracting all the action. If this is the case, it would break the control Comex has over the gold market and likely lead to much higher prices sooner rather than later.

QTR’s Disclaimer: Please read my full legal disclaimer on my About page here. This post represents my opinions only. In addition, please understand I am an idiot and very often get things wrong and lose money. I may own or transact in any names mentioned in this piece at any time without warning, meaning if I’m long I could sell or if I’m short I could cover at any time. Positions can change immediately. This is not a recommendation to buy or sell any stocks or securities, just my opinions. I often lose money on positions I trade/invest in. I may add any name mentioned in this article and sell any name mentioned in this piece at any time, without further warning.
I also may or may not own names I write about and are watching. Sometimes I’m bullish without owning things, sometimes I’m bearish and own things I’m bearish on. Just assume my positions could be exactly the opposite of what you think they are just in case. If I’m long I could quickly be short and vice versa. I won’t update my positions.
I cannot guarantee the accuracy of any or all facts and figures included in this article though I made an effort to get them right. I have been wrong before and will be wrong again, and encourage you to always double check, do your own research and speak to a licensed financial professional, which I am not.
Contributor posts, guest posts and curated posts have been hand selected by me, but have not been fact checked and are the opinions of their authors. They are either submitted to QTR by their author or reprinted under a Creative Commons license with my best effort to uphold what the license asks, or with the permission of the author.
Since 2026, I have been making an attempt to no longer actively trade as much as I once did (read my story here). In an attempt to lead a healthier lifestyle, I’ve also excluded myself from most fantasy sports, sports betting, online and in-person casinos and prediction markets.
My goal is for my investing/saving to be done by recurring contributions mostly to sector ETFs and a few select equities, trusted third parties who oversee my accounts, and advisors. Such advisors or funds, through individual equities, options, index funds, mutual funds, ETFs, or other securities, may have positions in, exposure to, or holdings of names mentioned herein that I know nothing about. Basically, it is possible I could own, have exposure to, or not own anything, at any point.
You are on your own. Do not make decisions based on my blog. I exist on the fringe. Again, I get shit wrong a lot, both in the market and in life, but am trying my best. If you see numbers and calculations of any sort, assume they are wrong and double check them. I failed Algebra in 8th grade and topped off my high school math accolades by getting a D- in remedial Calculus my senior year, before becoming an English major in college so I could bullshit my way through things easier. Hence, I am a writer. I write these posts after a couple beers sometimes. Many times I edit after my posts are published because I’m impatient and lazy, so if you see a typo, check back in a half hour. Thanks, you’ve been a great crowd and don’t forget to tip your servers.
I call it the "Crimex". I don't trust any of their supposed data. EVERYTHING involving gold and silver trading subject to fedgov regulation (or even influence) is manipulated to a "fare-thee-well"!
Silver is in physical deficit, it’s only a matter of time.