

Today I’m extremely happy to be bringing you the latest from my friend Lyn Alden.
Lyn’s background bridges the fields of engineering and finance. She holds a bachelor’s degree in electrical engineering and a master’s degree in engineering management, specializing in engineering economics, systems engineering, and financial modeling. Her early career included roles as an electrical engineer and later an engineering lead at the Federal Aviation Administration’s William J. Hughes Technical Center.

Alden has been a passionate investor for years. From 2010 to 2015, she ran her first investing website as a part-time venture, eventually selling it to a larger publishing company. In late 2016, she founded Lyn Alden Investment Strategy, a research firm that grew significantly, leading her to leave engineering management in 2021 to focus on finance full-time.
Now an independent analyst, Alden aims to deliver institutional-level research in clear, accessible language for both professional and retail investors. She also serves as an independent director on the board of Swan.com and is a general partner at the venture capital firm Ego Death Capital. In 2023, she published the best-selling book Broken Money (congrats on more than 100,000 copies sold, Lyn!) exploring the history, present, and future of money through a technological lens.
Lyn is an investor I always read and always love to hear from, so I was grateful she gave me permission to share this month’s research with my subscribers. I’m sure you’ll find it as valuable as I do.
The So-Called “Debasement Trade”
December 3, 2025
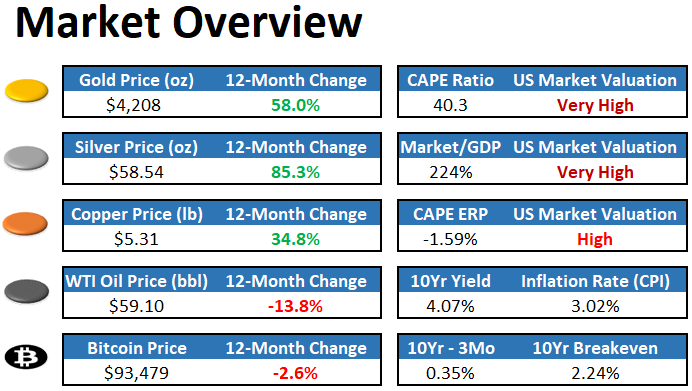
This newsletter issue analyzes what has become known as “the debasement trade” to see where it is true, and where it is misleading.
This issue is supported by YCharts, which I use for both stock-specific and macroeconomic research and visualization. You can access a free trial here.
The Debasement Trade
Back on October 9th, the Guardian ran a piece about the so-called debasement trade. Here’s how the article started:
Investors are piling into assets such as gold, bitcoin and shares amid worries about government debt, central bank independence, and the weakness of major currencies such as the dollar. The trade has even been given a moniker: the “debasement trade”.
Earlier that week, as referenced in that Guardian article, Ken Griffin of Citadel Securities (the largest market-maker on major US stock exchanges) had discussed it:
Ken Griffin, the founder and chief executive of the hedge fund Citadel, said this week that investors were looking for ways to “effectively de-dollarise and de-risk their portfolios vis-a-vis US sovereign risk”.
“Inflation is substantially above target and substantially above target in all forecasts for next year. And it’s part of the reason the dollar’s depreciated by about 10% in the first half of this year. It’s the single biggest decline in the US dollar in six months, in 50 years,” Griffin told the Citadel Securities future of global markets conference.
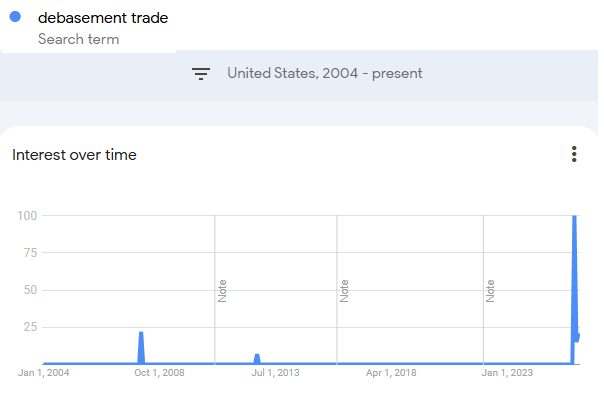
Until October 9th, the term wasn’t materially present in Google Trends, and then it popped. It quickly made its rounds across financial media and social media. Gold was breaking above $4,000/oz for the first time, and bitcoin was near its highs at around $120,000.
Of course, some of us that have been talking about currency debasement for a while found the sudden attention on the subject humorous.
Highlighting the risks of sovereign bonds has been one of my main talking points since 2019 with articles such as Are We in a Bond Bubble? (July 2019), The Subtle Risks of Treasury Bonds (Feb 2020), Treasury Market Dissonance (Aug 2020), Fiscal-Driven Inflation (May 2021), The Long-Term Fiscal Spiral (Nov 2022), Fiscal Dominance (July 2023), Why Nothing Stops this Fiscal Train (Sept 2024), and many more.
Sovereign bonds went on to have basically their worst 5-year period of performance ever from 2020 through 2025. They’re down nominally, and on an inflation-adjusted basis they’re even more negative.
Simply avoiding long-duration bonds and owning almost anything else has been one of the major tailwinds of this newsletter’s model portfolio. Stocks, gold, bitcoin, houses, art, whatever. They’ve all been winners relative to bonds at different speeds.


Narratives tend to follow price. Back in 2019 and 2020, people were talking about how “inflation is dead”, and there was $18 trillion worth of negative-yielding bonds in the world that institutional investors were quite comfortable holding. Fast forward to 2025, after many years of high inflation and devastating losses in bonds, and gold going up 3x and bitcoin going up 10x, the risk of sovereign bonds is now widely being talked about by major investment banks and major financial publications.
Ironically, as unattractive as bonds are, their rate of underperformance relative to stocks is likely to slow now. While I continue to expect bonds to lose purchasing power, it likely won’t be as rapid as the prior five years have been, and it’s less of an obvious “short bonds, long stocks” trade going forward. And yet that’s the current narrative, because it’s the trailing price behavior.
In reality, we’ve been in a five-decade debasement trade, not just a recent one.

But as the next section will show, some of those debasement aspects are likely to change, right when everyone is talking about it.
Five Decades of Debasement
The modern debasement trade began in the first half of the 20th century when governments began to gradually decouple their commercial banks from gold via an increasing layer of central bank abstraction and reduced currency-gold price pegs.
But it really kicked into high-gear in the second half of the 20th century when they decoupled from any sort of currency-gold price peg entirely.
Here are some charts from Broken Money:

One of the more straightforward ways to show the debasement is via the price of Campbell’s tomato soup. Rather than relying on a complex set of estimates and substitutions, it’s just a history record of what the same can of soup cost over time. The pivot point is pretty clear:

And then a bit later, starting from around 1980, the US kicked off a 40-year trend of lower interest rates from a very high level. This kept reducing the hurdle rate for valuing companies and other assets, resulting in structurally rising valuations. It also reduced the cost of borrowing to buy those assets, which incentivized taking out leverage and buying those assets.
As a result, total household net worth relative to GDP and relative to household disposable income kept climbing:


Of course, that net worth was rather concentrated. While nominal wealth generally went up across the board (in a diminishing unit of account), the top 1% went from owning 23% of the country’s household net worth in 1990 to 31% of the country’s net worth today. Those who held assets, and especially those who held conservatively leveraged assets (i.e. long assets, short fiat currency), had a structural tailwind in their favor relative to those who relied primarily on labor.

What’s different now is that 40-year cycle of ever-lower interest rates is over. Interest rates might not go up, but they’re unlikely to keep reaching lower-lows and lower-highs as they were before, especially since they had literally gone to zero. Asset prices no longer have that tailwind of ever-lower rates behind them.
While many individual assets will do well in the years ahead, I am doubtful that household net worth will keep smoothly rising relative to disposable income, and that the CAPE ratio for equities will keep rising far beyond levels seen only in the dotcom bubble. I think there’s a good chance that the structural peak in the ratio of household net worth to disposable is already in, and that the structural peak in the CAPE will be sometime soon. There are some things that could cause me to change my mind on that, but that’s my current perspective.
Now, to be clear, I still expect debasement to continue. And a metric I like to look at is interest-adjusted debasement. In other words, if money supply is growing by 7% per year, there’s a pretty big difference if an investor can get 1% on their 10-year bonds or 5% on their 10-year bonds.
-If you get only 1% on your bonds in that scenario, then your interest-adjusted debasement is 6% per year. Money supply is going up, but your money is earning only a very small share of those new units. You have an incentive to buy almost anything else.
-On the other hand, if you are getting 5% on your bonds in that scenario, then your interest-adjusted debasement is 2% per year, which is not that different from gold’s effective debasement rate via mining and storage/security fees. At this rate, it’s more of a close comparison.
This following chart shows the interest rate on 10-year bonds minus the annual growth rate of the US broad money supply. The lower it is, the faster the interest-adjusted debasement is occurring for bondholders:

After a long stretch of hawkish monetary policy in the 1980s and early 1990s (i.e. not a bad time to own bonds), this metric turned structurally negative from the late 1990s onwards. The 2010s in particular had a rather persistent -5% average interest-adjusted debasement rate for a while, which is pretty huge.
Then, the years 2020 and 2021 were utterly massive for debasement, briefly peaking at -25% for this metric. By 2022, the fiscal injections slowed down and the Fed tried to tighten monetary policy. This was effective for a period of time, with a temporarily declining money supply and high interest rates. However, that began reversing course, and recently the metric turned negative again.
Going forward, I expect money supply to generally resume growing at a faster year-over-year percentage rate than the interest rate on government securities, meaning this metric will be negative more often than not. However, it’s likely to spend a lot of time only moderately negative.
Thus, my base case is that we will find ourselves in a structural environment where debasement keeps occurring, but absolute hurdle rates and costs of capital are no longer declining (i.e. no more lower-lows in interest rates), and thus valuations for equities, houses, and other assets will have less of a structural tailwind behind them.
The Gradual Print
Since 2022, the Federal Reserve has been reducing its balance sheet from extraordinarily high post-2021 levels.
However, much like September 2019 when they ended their prior period of balance sheet reduction, they are now running into liquidity shortages and price spikes in repo markets.