

The Federal Government publishes the spending and revenue numbers on a monthly basis. The charts and tables below give an in depth review of the Federal Budget, showing where the money is coming from, where it is going to, and the surplus or deficit.
The government fiscal year closes at the end of September, but this analysis will look at the calendar year budget. As shown below, 8 of the last 9 months showed an almost $100B deficit. The only non-deficit month was the tax month of April.
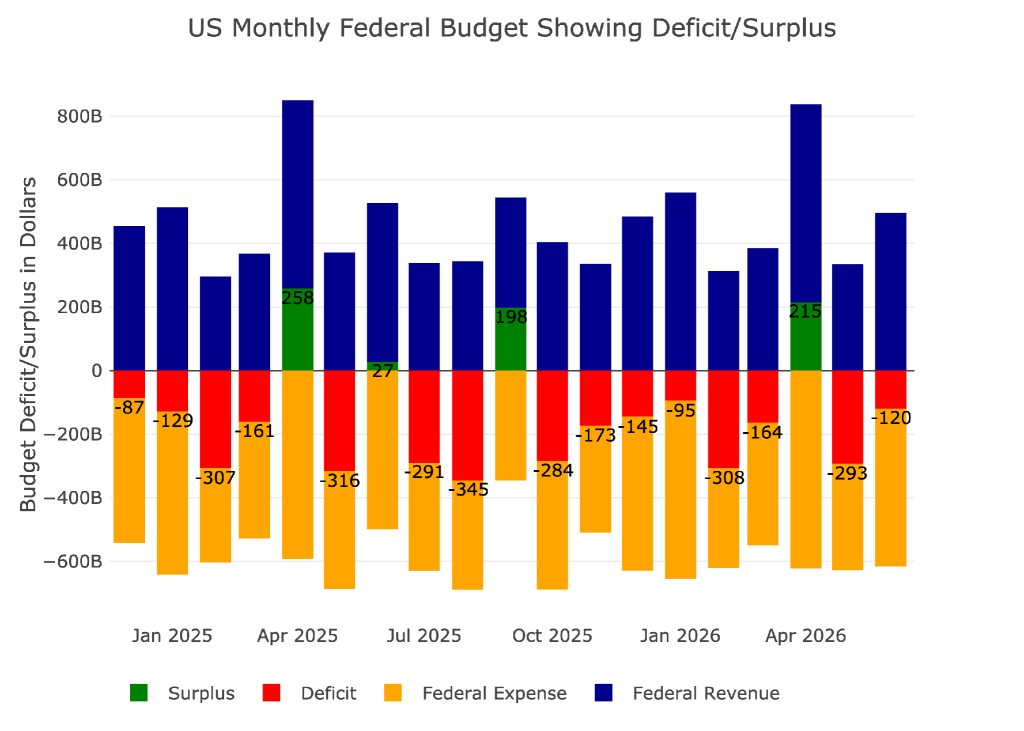
Figure: 1 Monthly Federal Budget
Looking at the average monthly deficit, May and June were both worse than average where April was a slightly higher surplus than average.
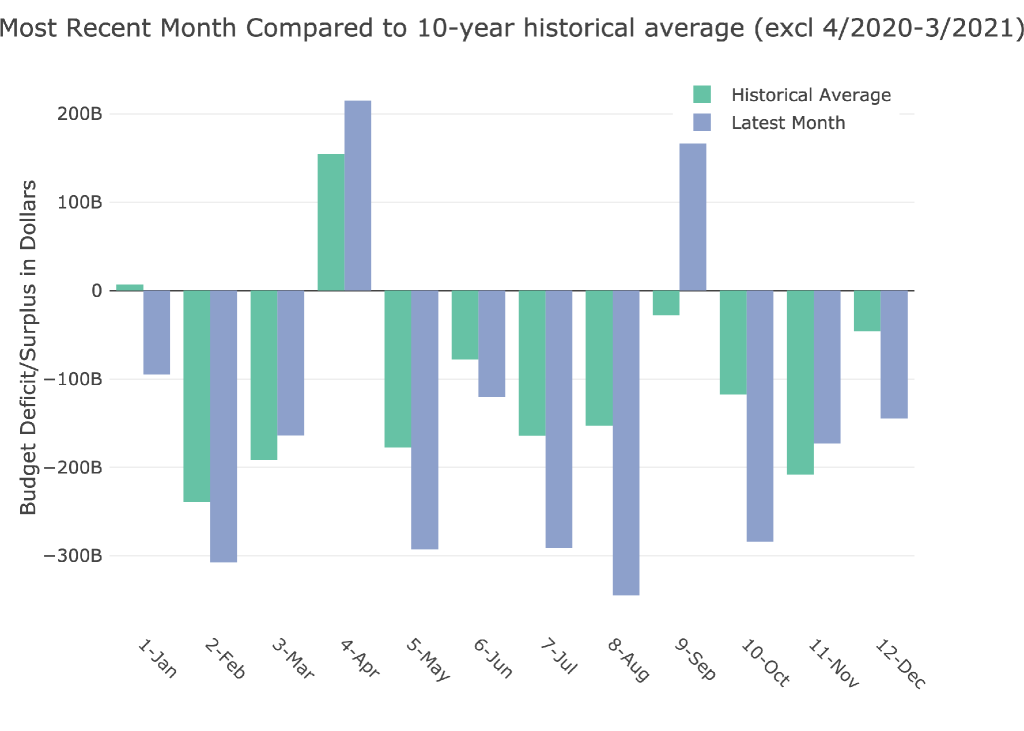
Figure: 2 Current vs Historical
We can look at the quarter in aggregate using the Sankey diagram below that shows the very large $198B deficit in the quarter that should be the best of the year because of the April surplus.
The big concern with the chart below is how much Interest Expense has moved up, making up 16.5% of all spending in Q2. This is now the second largest line item behind only Social Security. This is how debt spirals work. When interest becomes a massive burden on the budget, it does not bode well.
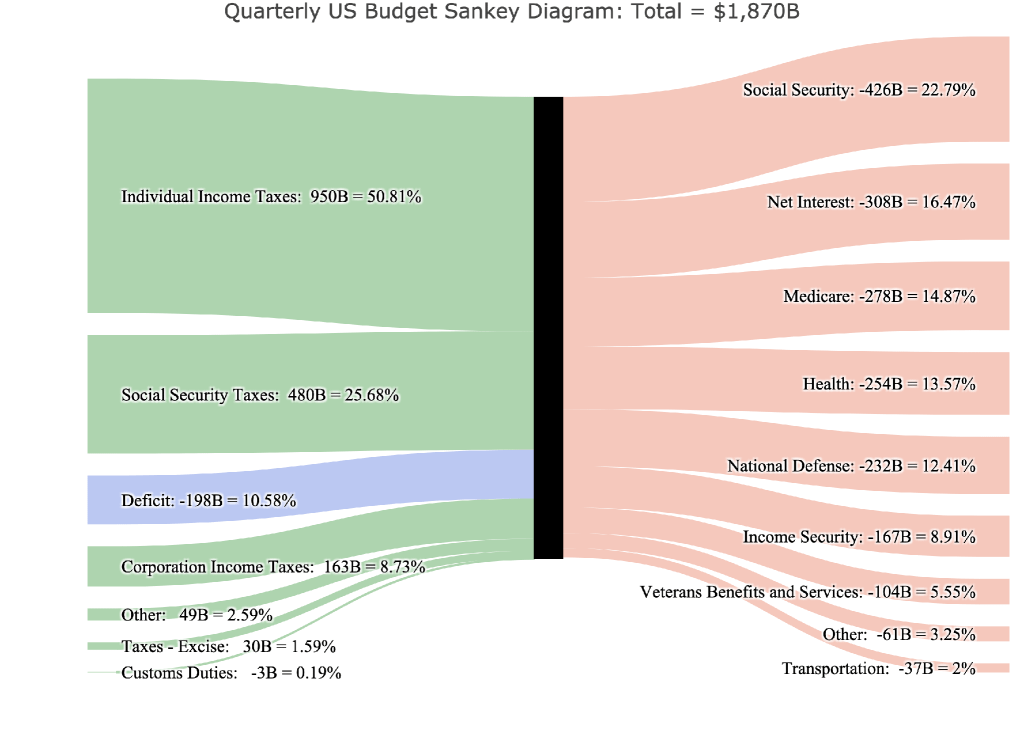
Figure: 3 Quarterly Federal Budget Sankey
As mentioned above, Q2 is usually the best quarter of the year because of the April tax month. Last year, the Q2 deficit was only $30B. This year, the quarterly deficit was 6.6x larger than it was last year. That is a really bad sign.
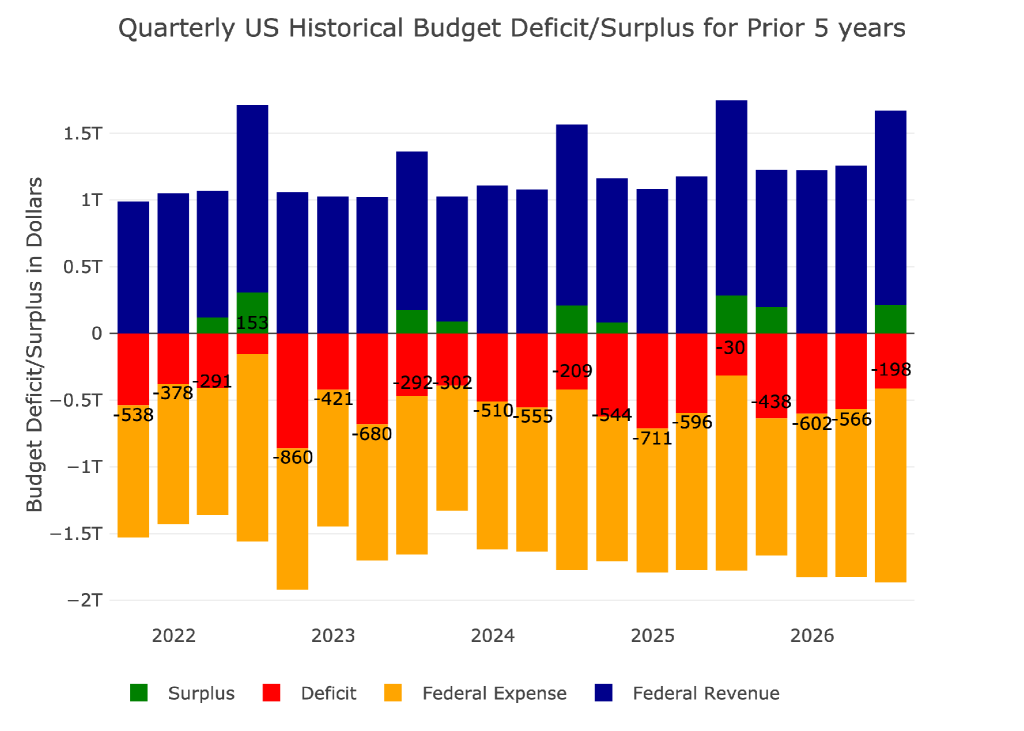
Figure: 4 Quarterly Historical Deficit/Surplus for Previous Five Years
The next two charts show the quarterly revenue and costs broken down by expense type. You can see how the revenue this year is actually smaller than the revenue last year for Q2. The big driver was tariff revenue, but social security was actually slightly down this year.
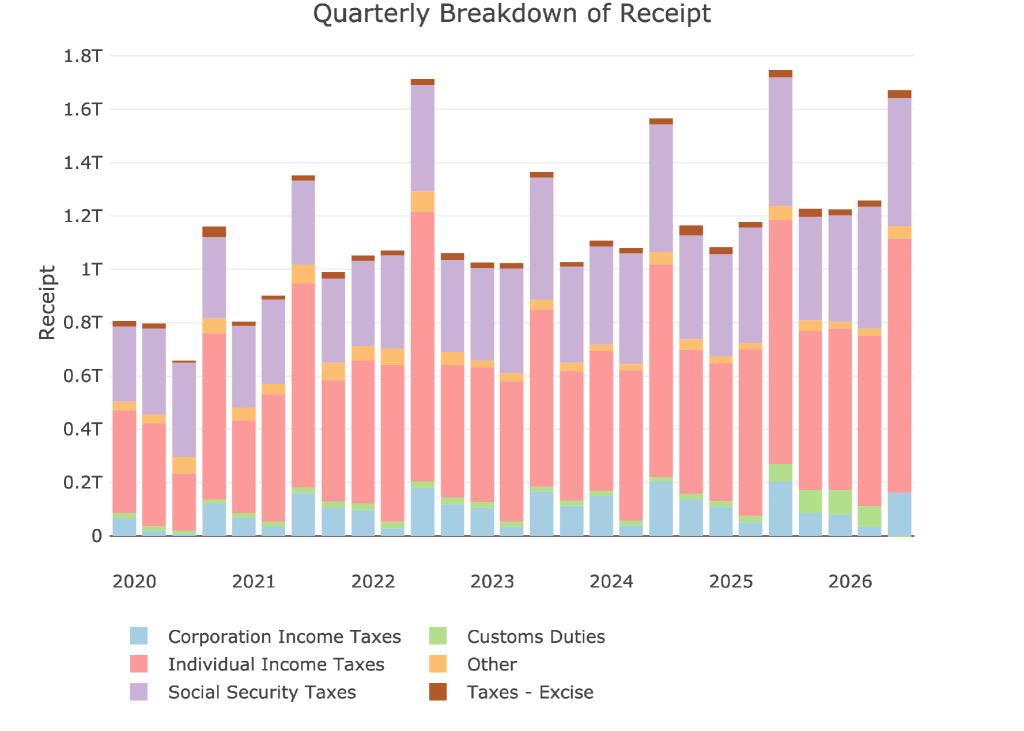
Figure: 5 Quarterly Receipts
On the flip side, you can see that spending continues to creep higher with no clear driver. It is just an increase in spending across the board… which is the hardest spending to combat.
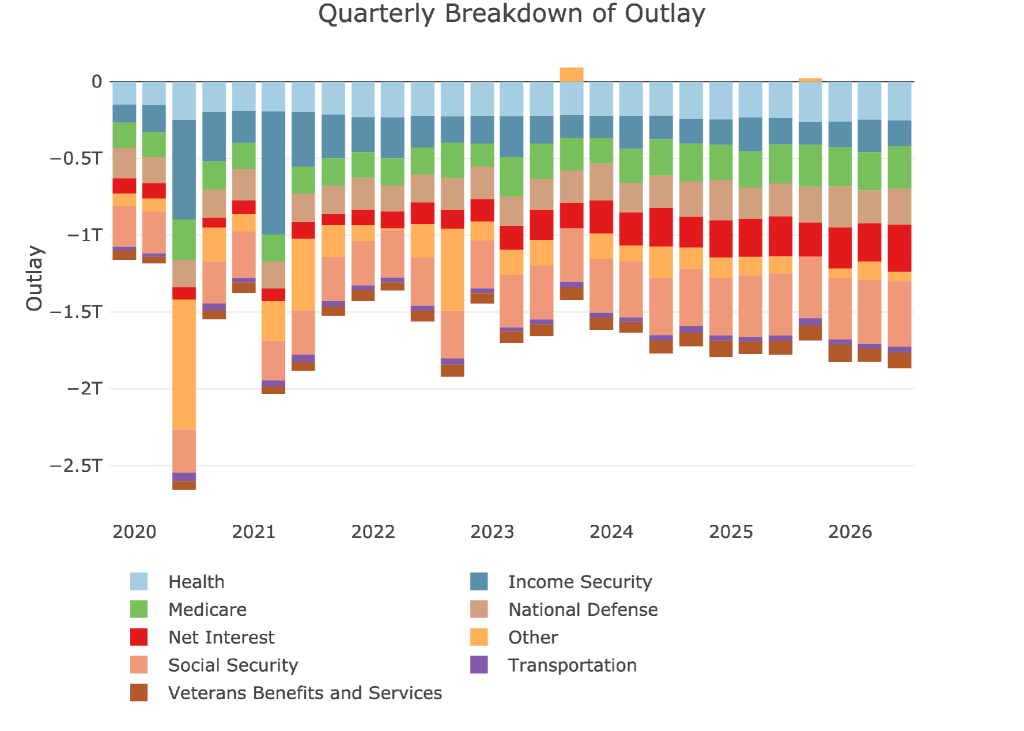
Figure: 6 Quarterly Outlays
Interest Expense has ballooned higher to $1.04T on a trailing twelve month basis. This is deadly for the budget. With the Fed unable to lower rates because of the elevated inflation, this leaves little relief in sight for interest expense.
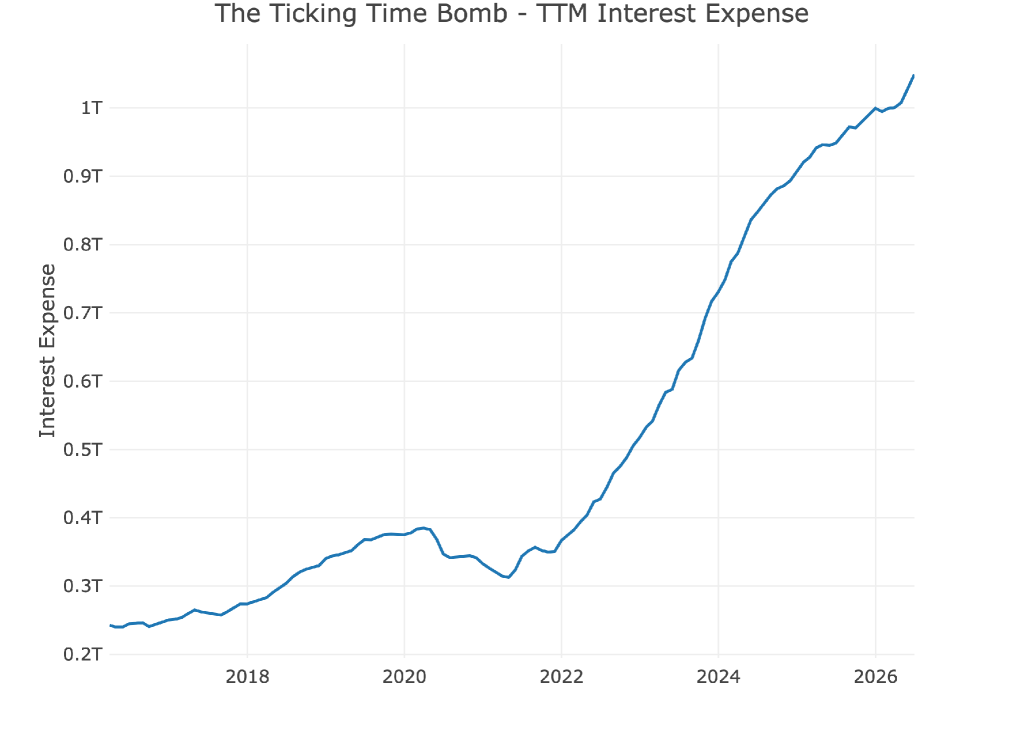
Figure: 7 TTM Interest Expense
Historical Perspective
Zooming out and looking over the history of the budget back to 2015 shows a more complete picture. The change since Covid is quite dramatic. In 2019, the deficit was $1.02T. As of June last year, it was $1.88T. Ironically, the most recent TTM is slightly smaller at $1.8T deficit.
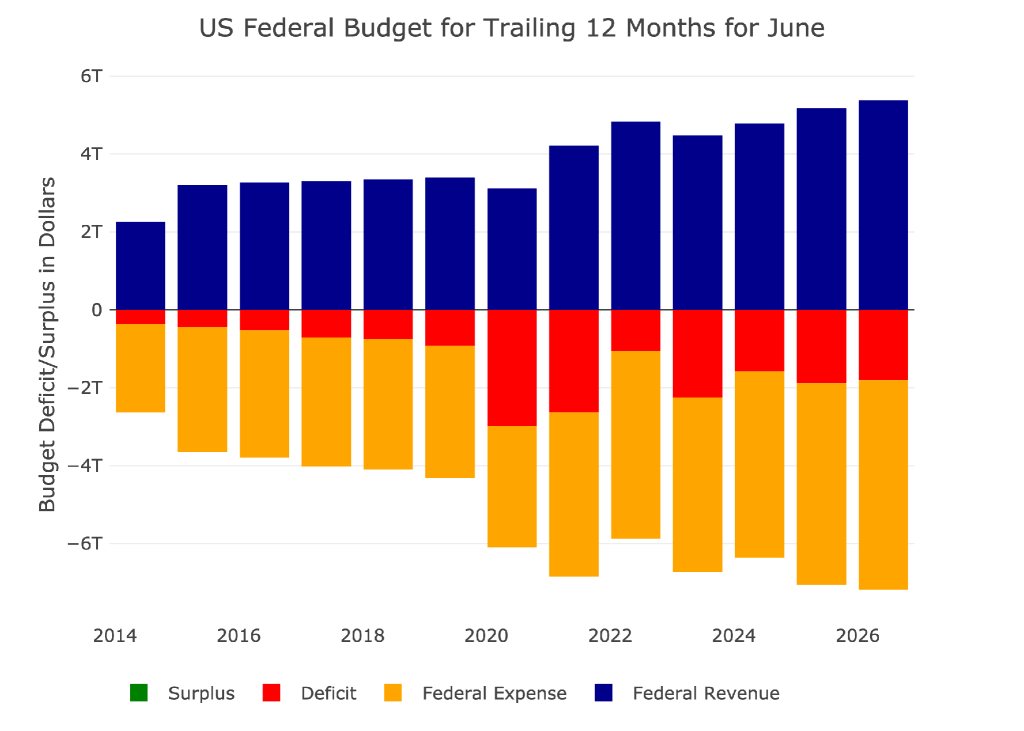
Figure: 8 Trailing 12 Months (TTM)
The next two charts zoom in on the recent periods to show the change when compared to pre-Covid. These charts show spending and revenue on a trailing 12 month basis period over period.
The last 12-months was a record revenue number at $5.38T. Tariffs directly contributed $250B, so as Tariff revenue dries up, the budget deficits are only going to get worse.
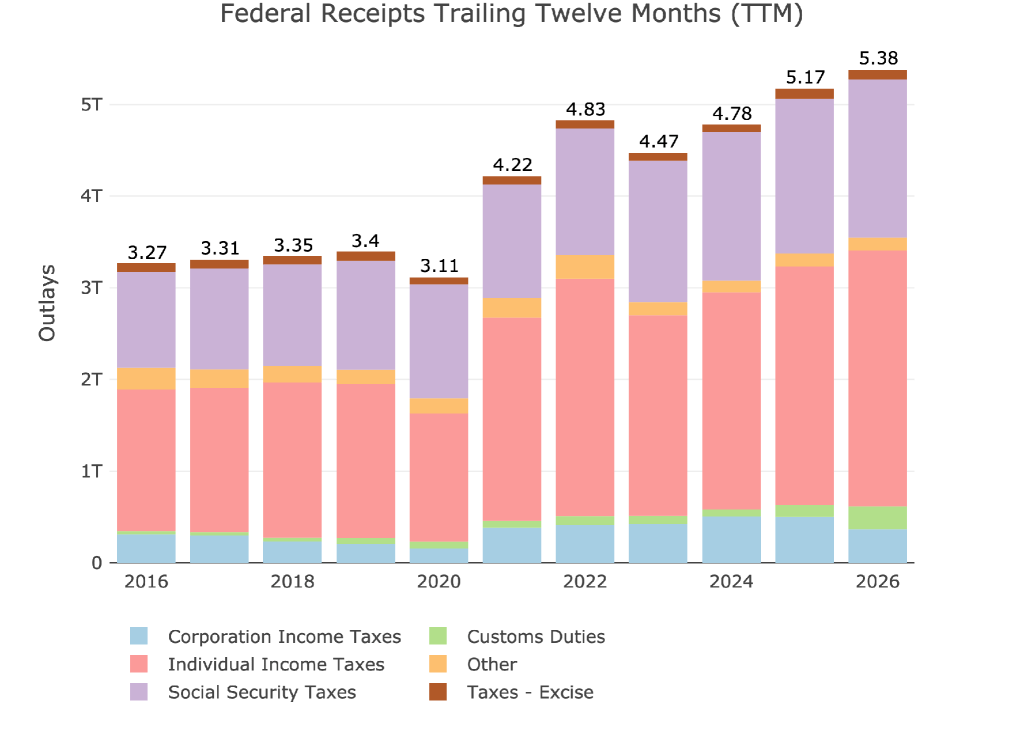
Figure: 9 Annual Federal Receipts
The spending chart really shows the impact of the growing interest expense. You can see how the red bar really starts to expand, but the same can be said for almost every other spending item.
Bottom line, in 10 years spending has grown 89% while revenue has grown 64%. That is not a great formula.
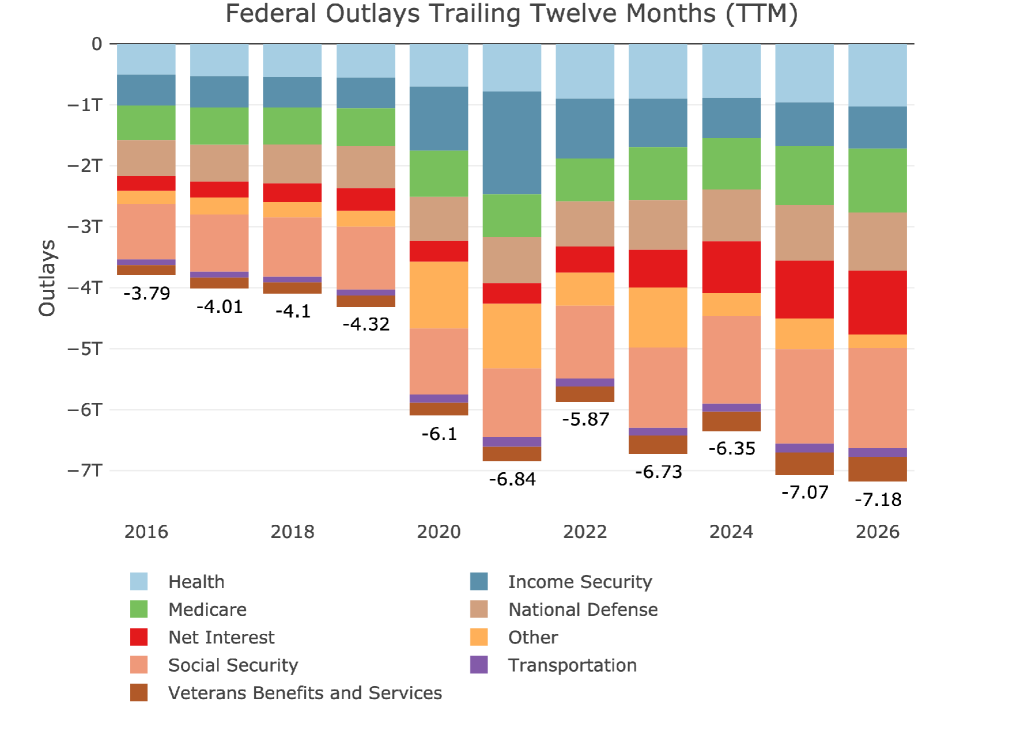
Figure: 10 Annual Federal Expenses
Finally, we finish with a Sankey showing TTM Deficit was -$1.8T which is a massive issue going forward, representing 25% of all government spending. The government cannot afford to keep printing such massive debt figures.
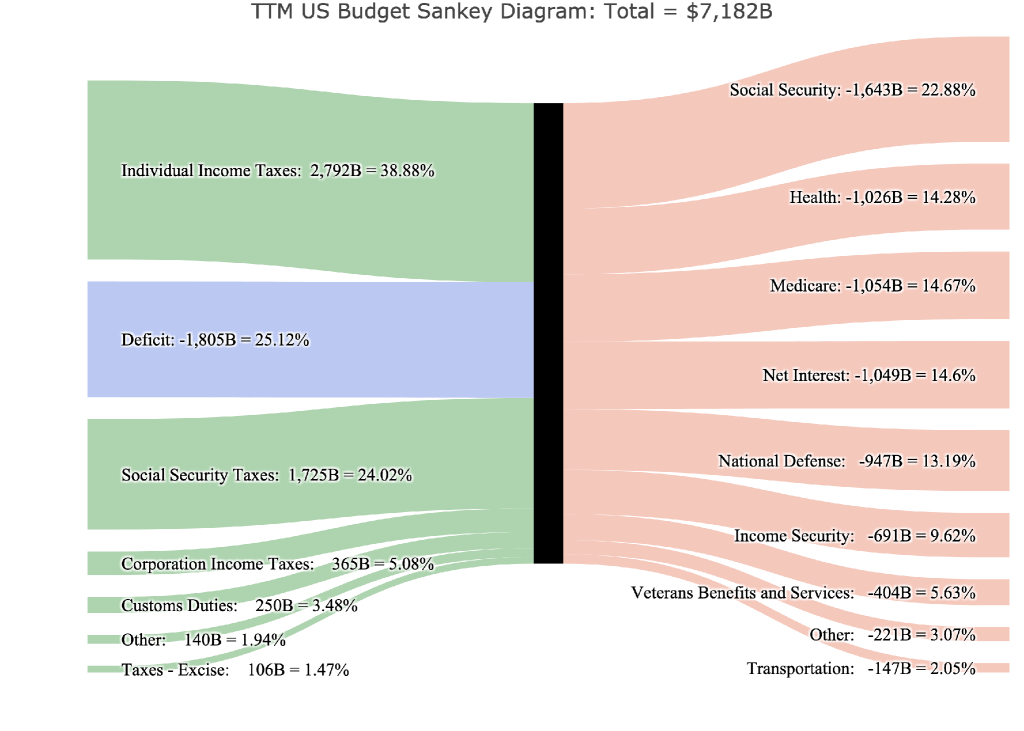
Figure: 11 TTM Federal Budget Sankey

QTR’s Disclaimer: Please read my full legal disclaimer on my About page here. This post represents my opinions only. In addition, please understand I am an idiot and often get things wrong and lose money. I may own or transact in any names mentioned in this piece at any time without warning. Contributor posts and aggregated posts have been hand selected by me, have not been fact checked and are the opinions of their authors. They are either submitted to QTR by their author, reprinted under a Creative Commons license with my best effort to uphold what the license asks, or with the permission of the author.
This is not a recommendation to buy or sell any stocks or securities, just my opinions. I often lose money on positions I trade/invest in. I may add any name mentioned in this article and sell any name mentioned in this piece at any time, without further warning. None of this is a solicitation to buy or sell securities. I may or may not own names I write about and are watching. Sometimes I’m bullish without owning things, sometimes I’m bearish and do own things. Just assume my positions could be exactly the opposite of what you think they are just in case. If I’m long I could quickly be short and vice versa. I won’t update my positions.
As of May 20, 2026 I am attempting to no longer actively trade (read my story here). My investing/saving is mostly done by recurring contributions mostly to sector ETFs and a few select equities, trusted third parties who oversee my accounts, and advisors. Such advisors or funds, through individual equities, options, index funds, mutual funds, ETFs, or other securities, may have positions in, exposure to, or holdings of names mentioned herein that I know nothing about. Basically, via index funds, ETFs and individual equities it is possible I could own, have exposure to, or not own anything at any point. As of the same date, May 20, 2026, in an attempt to lead a healthier lifestyle, I’ve also excluded myself from fantasy sports, sports betting, online and in-person casinos and prediction markets.
And all positions can change immediately as soon as I publish this, with or without notice and at any point I can be long, short or neutral on any position. You are on your own. Do not make decisions based on my blog. I exist on the fringe. If you see numbers and calculations of any sort, assume they are wrong and double check them. I failed Algebra in 8th grade and topped off my high school math accolades by getting a D- in remedial Calculus my senior year, before becoming an English major in college so I could bullshit my way through things easier.
The publisher does not guarantee the accuracy or completeness of the information provided in this page. These are not the opinions of any of my employers, partners, or associates. I did my best to be honest about my disclosures but can’t guarantee I am right; I write these posts after a couple beers sometimes. I edit after my posts are published because I’m impatient and lazy, so if you see a typo, check back in a half hour. Also, I just straight up get shit wrong a lot. I mention it twice because it’s that important.
The fedres will keep "printing" confetti until it is no longer accepted in payment for goods and services.
At this point, might as well put the foot on the accelerator and get where we're going.