

The analysis below covers the Employment picture released on the first Friday of every month. While most of the attention goes to the Headline Report, it can be helpful to look at the details, revisions, and other reports to get a better gauge of what is really going on.
Current Trends
The jobs report showed a gain of 178k jobs for the month of March. While that beat expectations, it will most likely be revised down in future months. Furthermore, the Household Survey showed a loss of 64k jobs. This is another consistent trend: the Household Survey continuously underperforming the Headline Report.
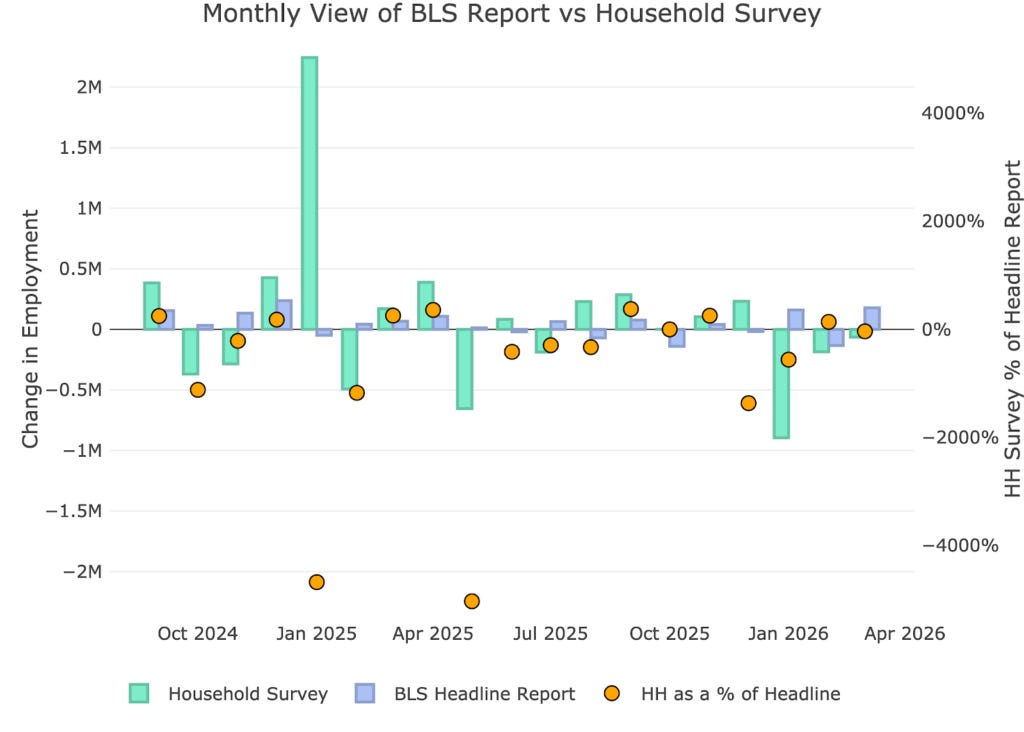
Figure: 1 Primary Report vs Household Survey – Monthly
To show the magnitude of this underperformance, consider the chart below. YTD, the Headline Report shows a gain of 205k jobs where the Household Survey shows a loss of 1.4M jobs.
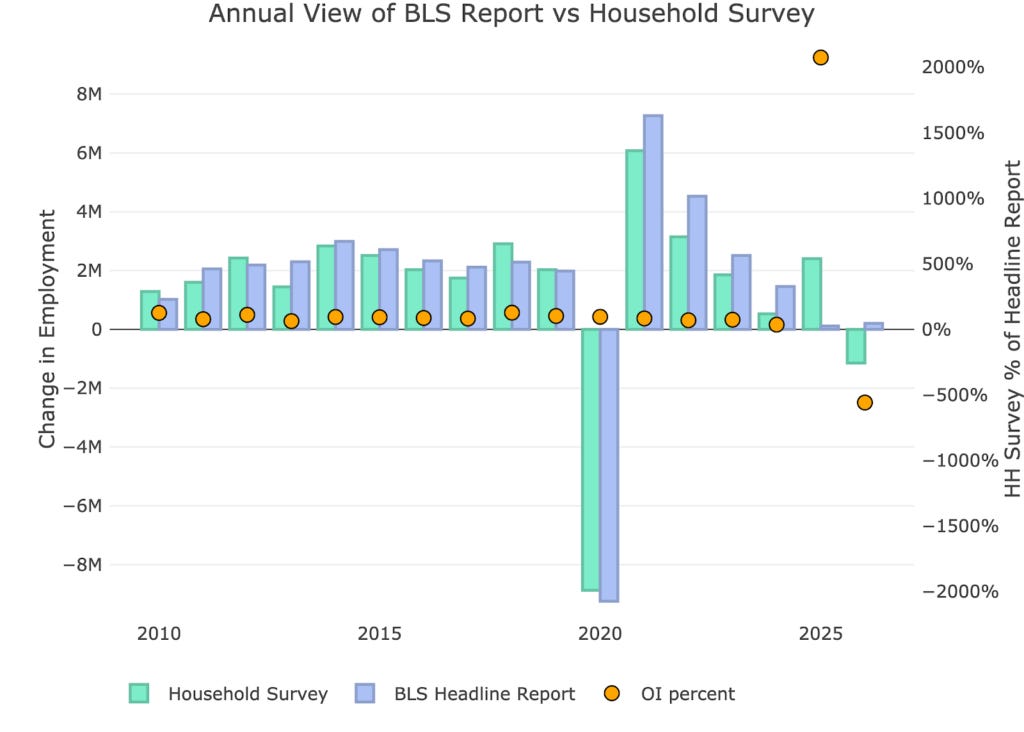
Figure: 2 Primary Report vs Household Survey – Annual
The BLS publishes the data behind their Birth/Death assumptions (formation of new business). The data showed that the BLS assumed a job loss of 47k jobs in March.
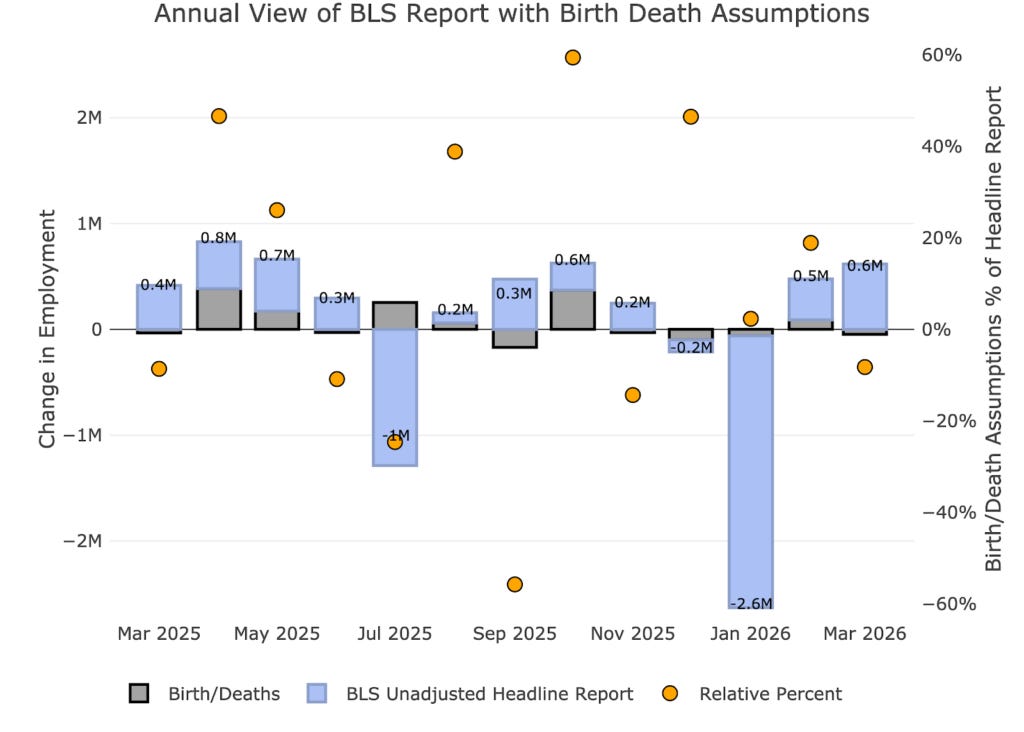
Figure: 3 Primary Unadjusted Report With Birth Death Assumptions – Monthly
For the year, the birth death assumption is -18k jobs.
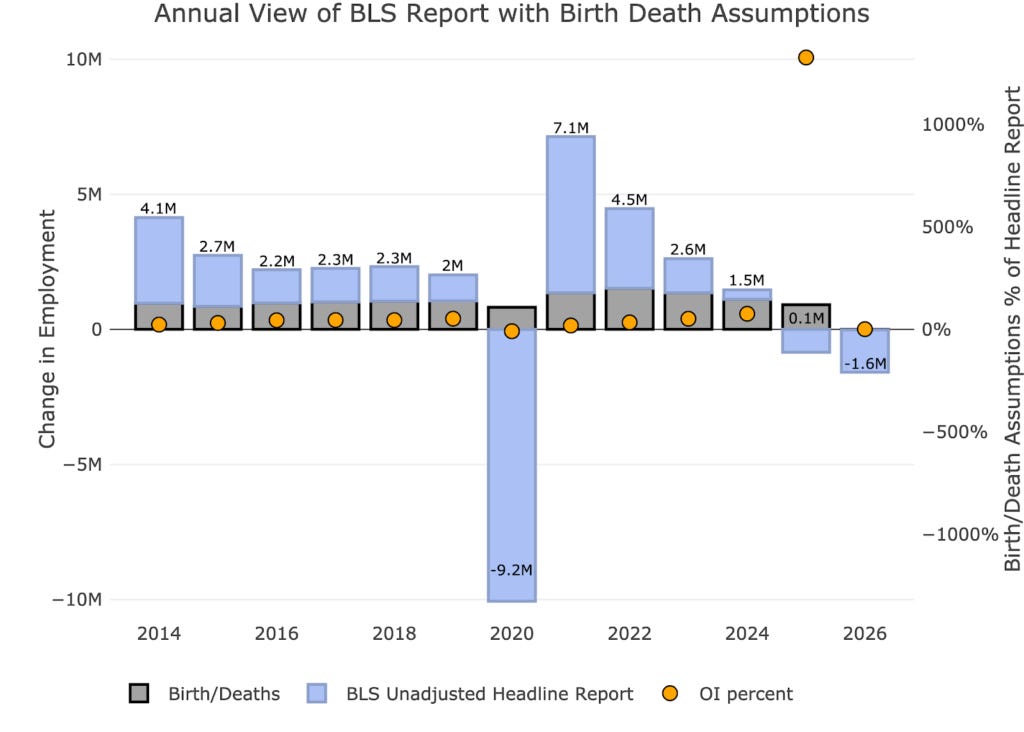
Figure: 4 Primary Unadjusted Report With Birth Death Assumptions – Monthly
The big report released earlier this month is the Quarterly Census of Employment and Wages (QCEW). According to the BLS, this is a far more accurate and rigorous report covering 95% of jobs available at a highly detailed level. Due to the rigor, the report is released quarterly on a several month lag.
The latest report is for Q3 2025. As shown, July and September were both below the Headline Report.
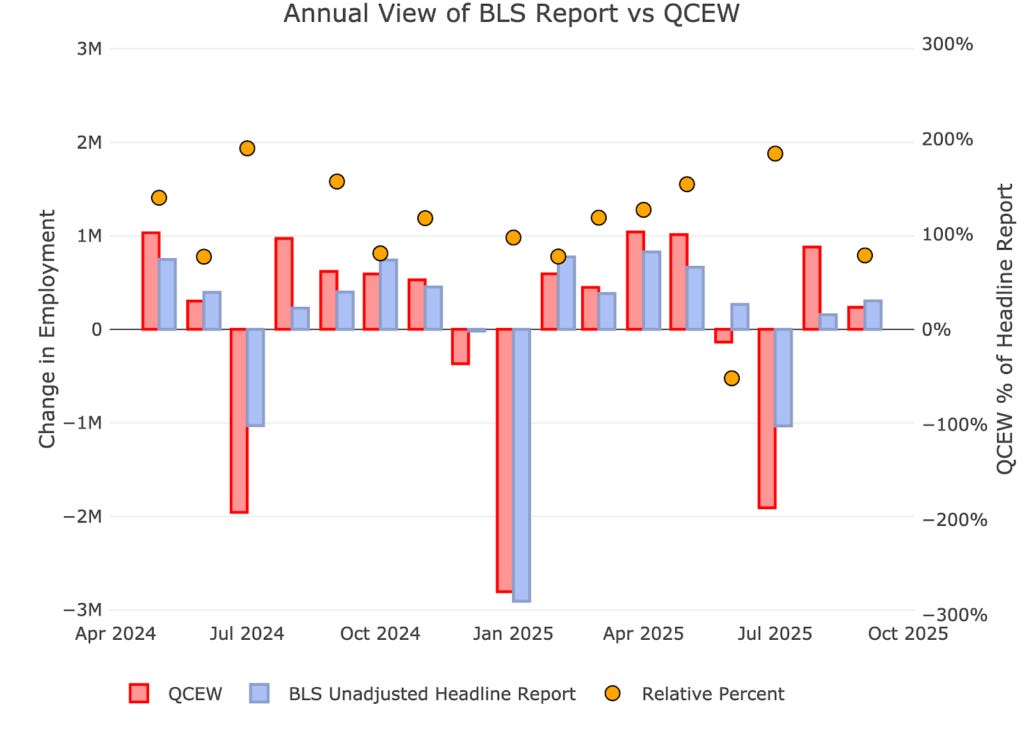
Figure: 5 Primary Report vs QCEW – Yearly
This QCEW data reveals that the economy lost jobs through 3 quarters in 2025. The revised Headline Report also shows this job loss, but the QCEW shows an even more negative picture of -633k (vs -560k for the Headline Report). This just pours salt in the wound of an already terrible story.
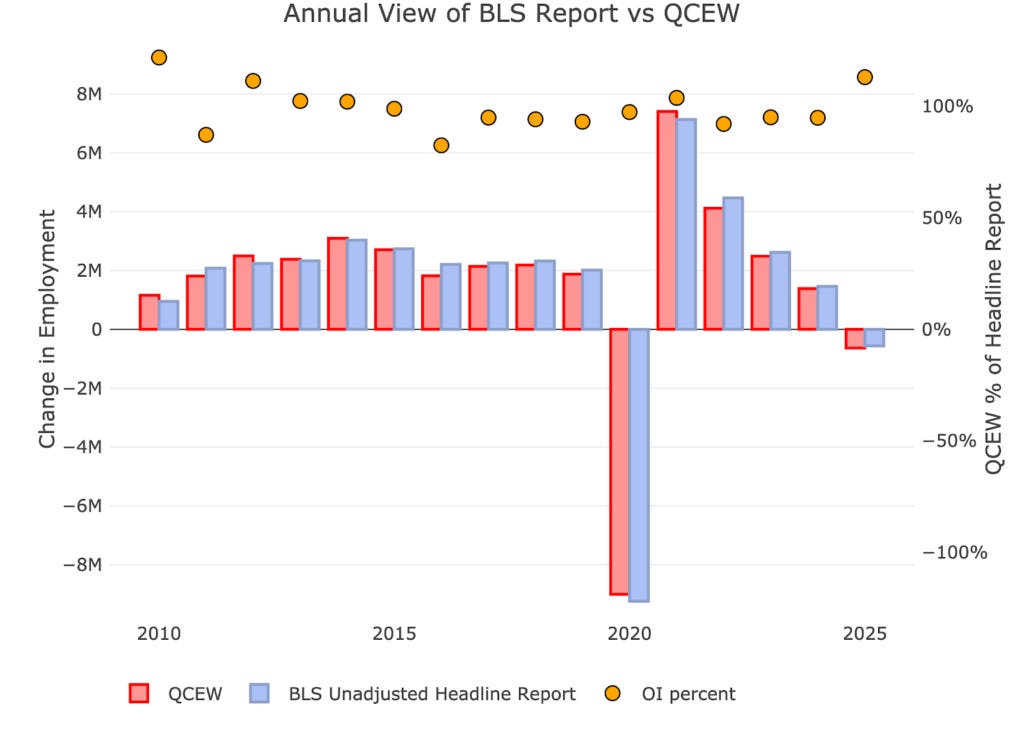
Figure: 6 Primary Report vs QCEW – Yearly
Digging Into the Headline Report
Unfortunately, despite being highly unreliable, the Headline report is the best data we have for the more recent periods. Furthermore, this is the data the Fed uses to shape its policy. The 178k jobs gained is the third best month since September 2024.
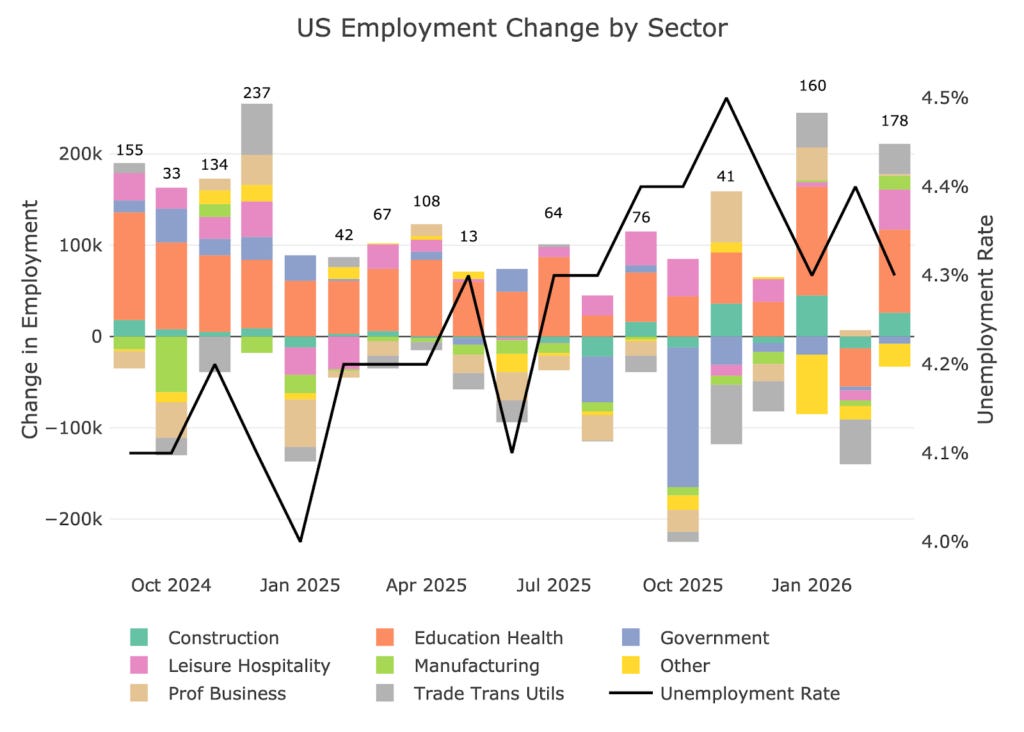
Figure: 7 Change by sector
Jobs by Category
When looking at the last 12-month trend, you can see that every job category was above trend except for Other. As for the trend, 5 of 8 categories are actually negative over the last year.
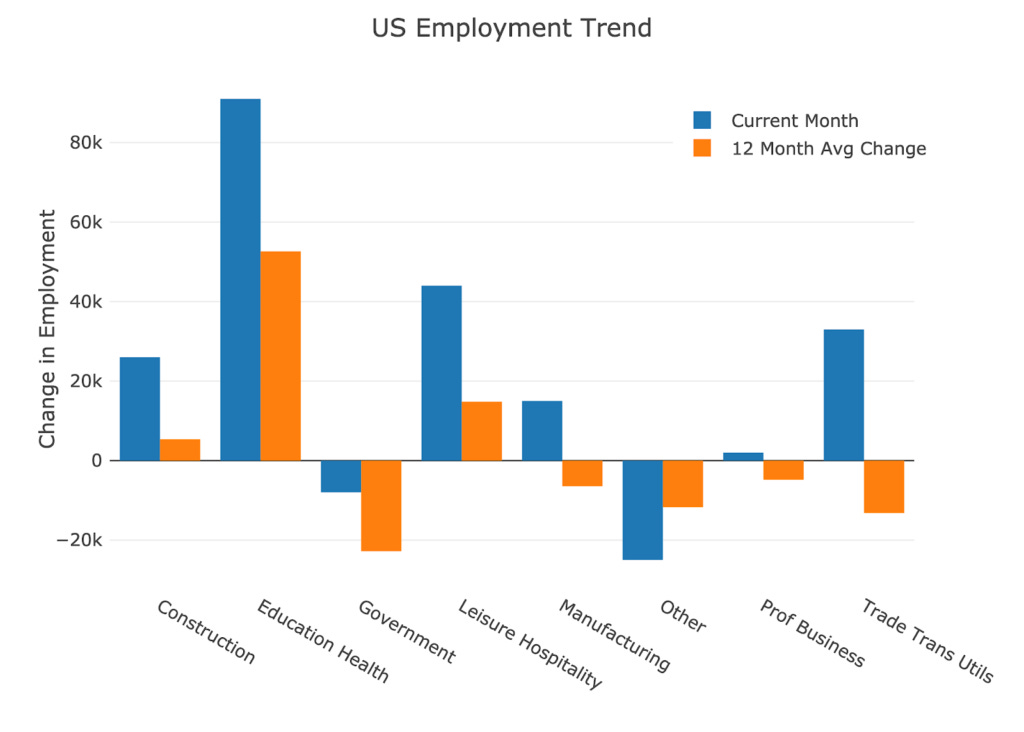
Figure: 8 Current vs TTM
The table below shows a detailed breakdown of the numbers.
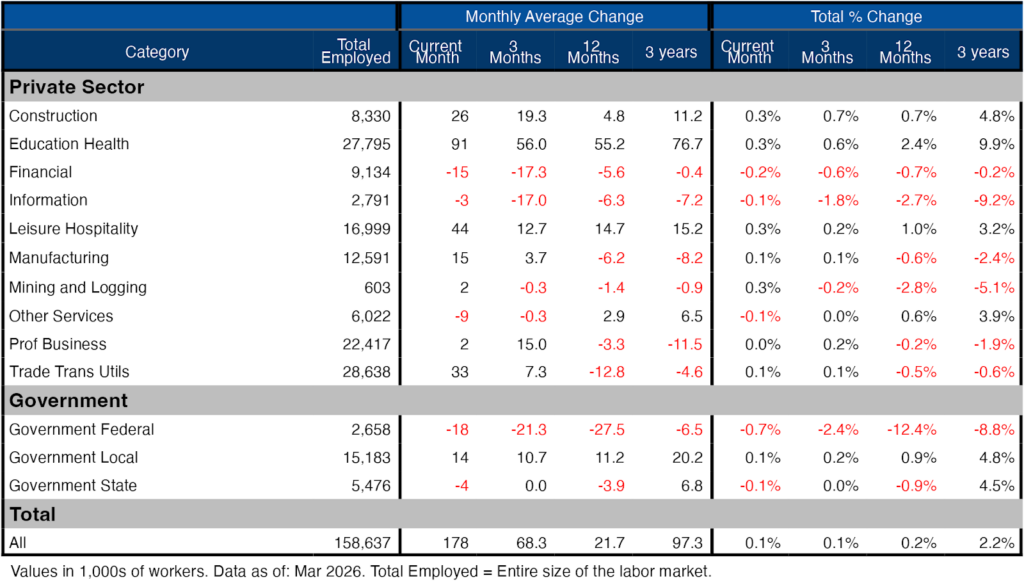
Figure: 9 Labor Market Detail
Revisions
This is the biggest story of the jobs report. After all the revisions, the job picture is significantly bleaker than the data originally showed. Every month shown below saw a negative revision except for January of this year. For February, the original 92k jobs lost has been revised to a loss of 133k.
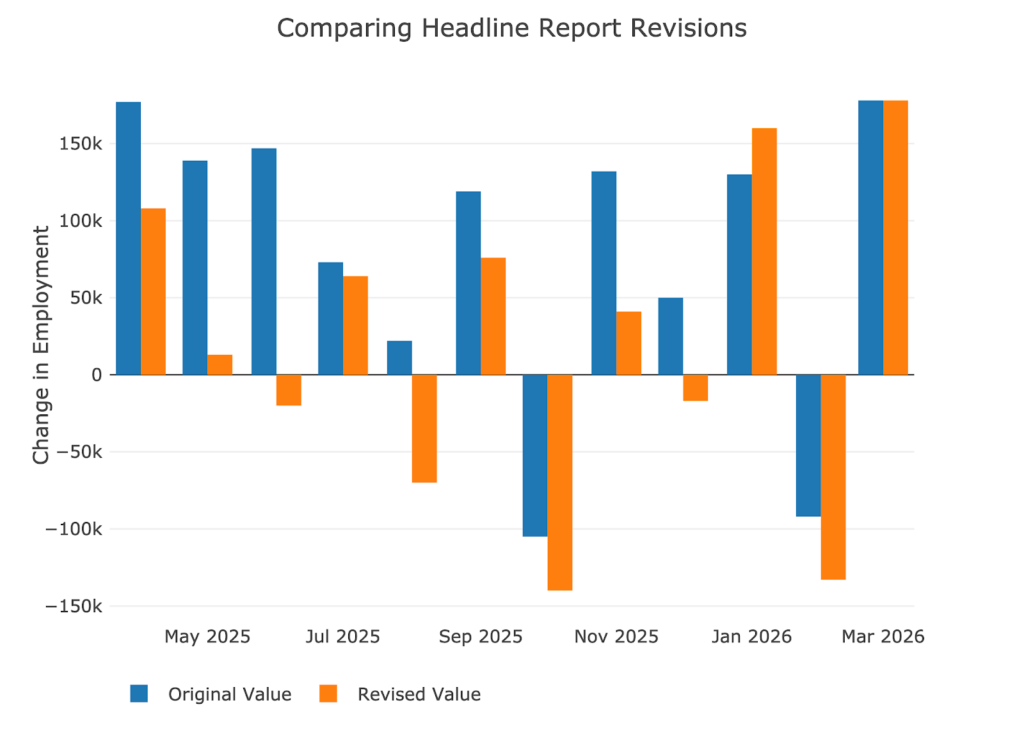
Figure: 10 Revisions
Over the last twelve months, jobs have been revised down by about 90k per month!
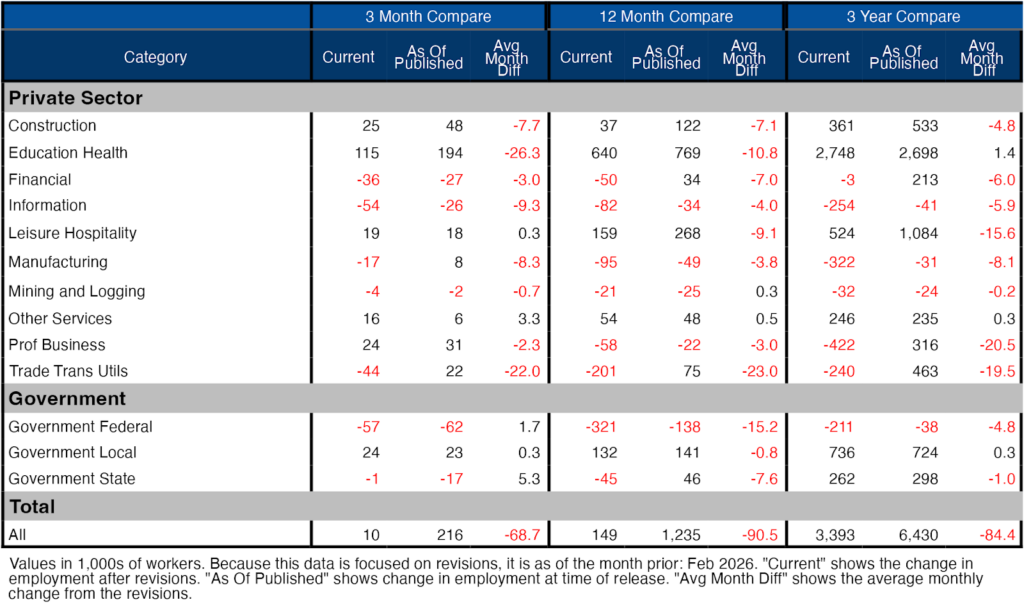
Figure: 11 Revisions
More Detail in the Household Survey
Another level of detail in the Household report shows full-time vs part-time job holders. The data shows full time jobs being added in March.
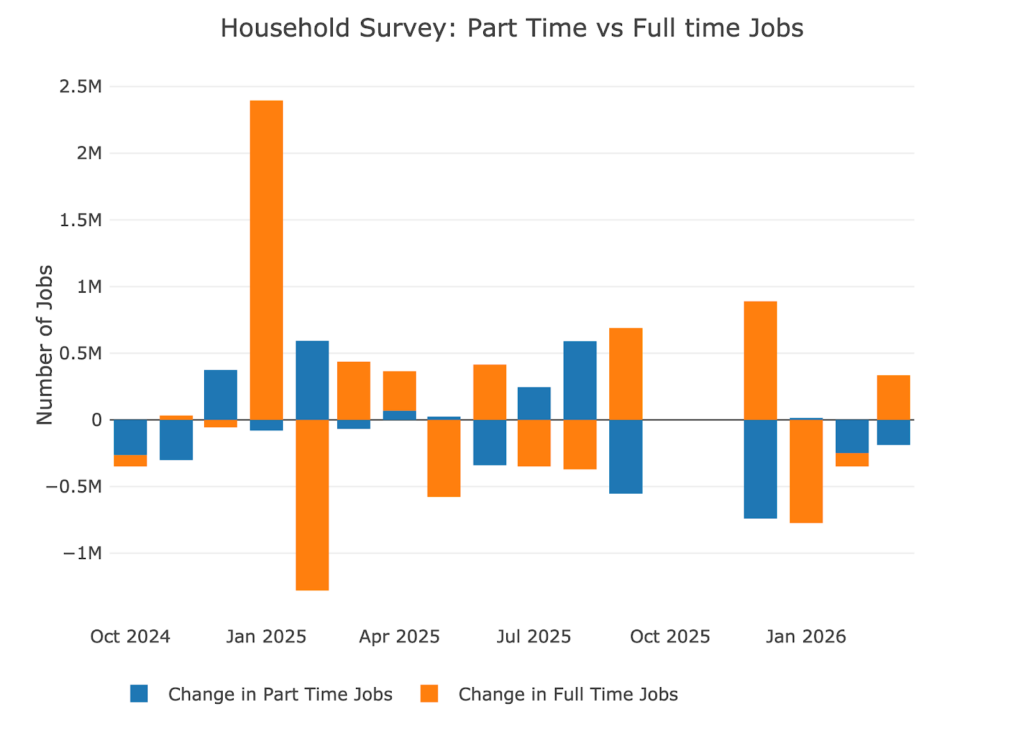
Figure: 13 Full Time vs Part Time
Historical Perspective
The chart below shows data going back to 1955.
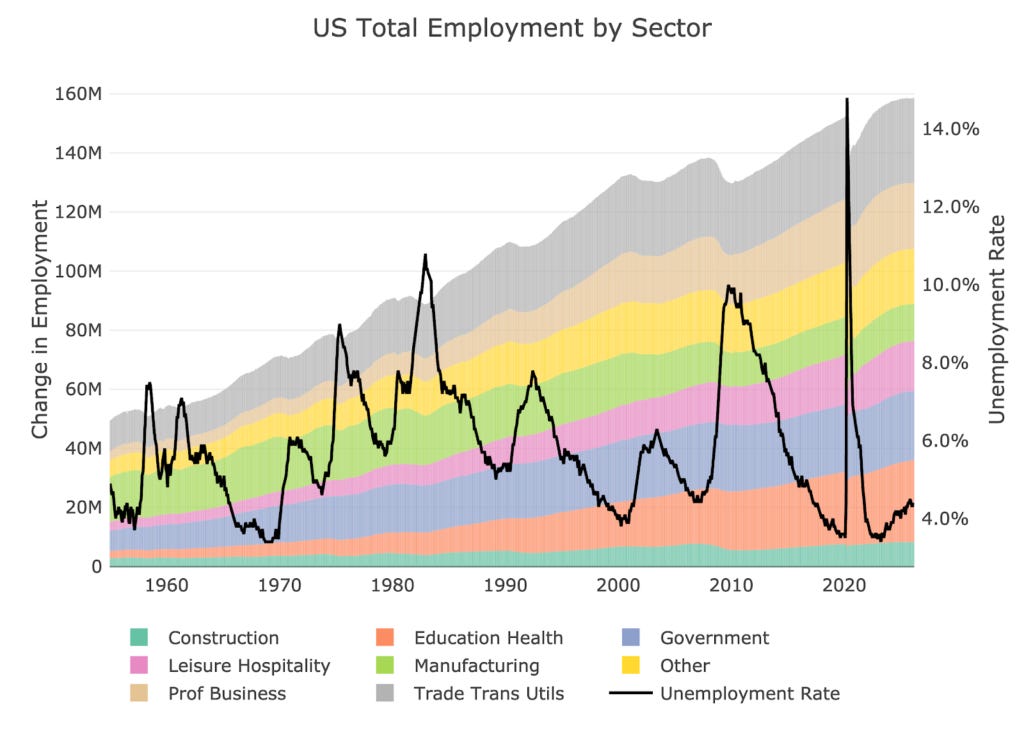
Figure: 14 Historical Labor Market
The labor force participation rate is still well below the highs before the Global Financial Crisis. This month showed it falling to 61.9%, the lowest level since 2021.
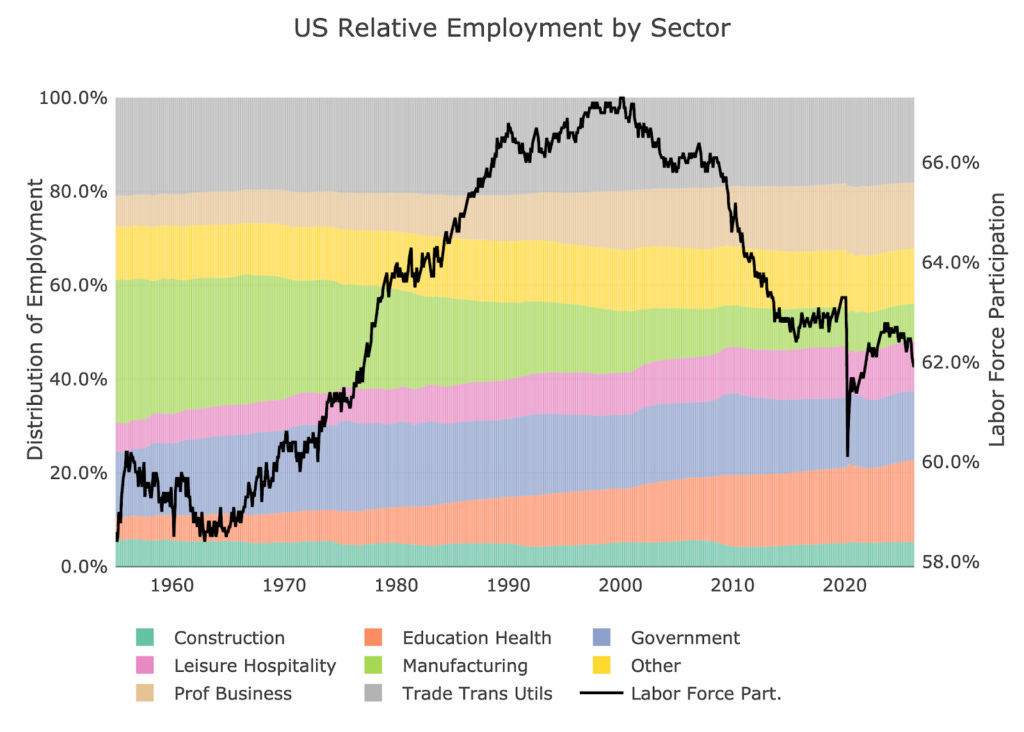
Figure: 15 Labor Market Distribution
Conclusion
Ignore the unexpected positive job growth this month. The full data shows a very negative picture.
Household Survey: recession level ugly
QCEW Shows 633k jobs lost in first 3 quarters of 2025
Revisions: constantly moving downward
Labor force participation falls to a multi-year low
This is the sign of an economy hanging by a thread.

QTR’s Disclaimer: Please read my full legal disclaimer on my About page here. This post represents my opinions only. In addition, please understand I am an idiot and often get things wrong and lose money. I may own or transact in any names mentioned in this piece at any time without warning. Contributor posts and aggregated posts have been hand selected by me, have not been fact checked and are the opinions of their authors. They are either submitted to QTR by their author, reprinted under a Creative Commons license with my best effort to uphold what the license asks, or with the permission of the author.
This is not a recommendation to buy or sell any stocks or securities, just my opinions. I often lose money on positions I trade/invest in. I may add any name mentioned in this article and sell any name mentioned in this piece at any time, without further warning. None of this is a solicitation to buy or sell securities. I may or may not own names I write about and are watching. Sometimes I’m bullish without owning things, sometimes I’m bearish and do own things. Just assume my positions could be exactly the opposite of what you think they are just in case. If I’m long I could quickly be short and vice versa. I won’t update my positions. All positions can change immediately as soon as I publish this, with or without notice and at any point I can be long, short or neutral on any position. You are on your own. Do not make decisions based on my blog. I exist on the fringe. If you see numbers and calculations of any sort, assume they are wrong and double check them. I failed Algebra in 8th grade and topped off my high school math accolades by getting a D- in remedial Calculus my senior year, before becoming an English major in college so I could bullshit my way through things easier.
The publisher does not guarantee the accuracy or completeness of the information provided in this page. These are not the opinions of any of my employers, partners, or associates. I did my best to be honest about my disclosures but can’t guarantee I am right; I write these posts after a couple beers sometimes. I edit after my posts are published because I’m impatient and lazy, so if you see a typo, check back in a half hour. Also, I just straight up get shit wrong a lot. I mention it twice because it’s that important.
Manufacturing is way down over the decades, likely due to a combination of productivity increases (it takes far fewer workers to assemble an automobile today than 50 years ago) and offshoring (where it takes zero American jobs to assemble).
Contrast this to the explosive growth of education and healthcare, neither of which can be offshored and both of which are largely immune to gains in efficiency. And both are heavily unionized.
Then we have the A.I. joboclypse well under way. The construction workers and plumbers will do fine, the "knowledge workers" better start learning a trade.
Remember "Learn to code"?
I have been watching the Labor Force Participation Rate bleed away since 2012 (with few but somewhat briefly encouraging upticks). It’s been wild watching celebrating over a supposedly “good” job addition number that would have been a horrible one if you applied the LFPR from just 18-24 months earlier.
At some point we”ll have only four people in the labor force doing 12 jobs each and headlines happily proclaiming a historically unprecedented NEGATIVE unemployment rate.