

By Ryan McMaken, Mises Institute
The money supply has nearly flatlined in 2025, with July’s total money supply increasing by only $39 billion over the past seven months. The total size of the money supply still remains more than $5 trillion above its pre-covid total—an increase of 35 percent— but trends in delinquencies, employment, and home sales have put downward pressure on the money supply throughout much of 2025.
As of July, year-over-year growth in the money supply was at 2.45 percent. That’s down slightly from June’s year-over-year increase of 2.49 percent. Money supply growth is also up compared to July of last year when year-over-year growth was -0.43 percent. The money supply has now increased, year over year, for twelve months in a row, following a very volatile period of immense growth in the money supply—i.e., during 2020 and 2021—followed by eighteen months of sizable declines in the money supply during 2023 and 2024. Since then, however, money supply trends have largely flattened.
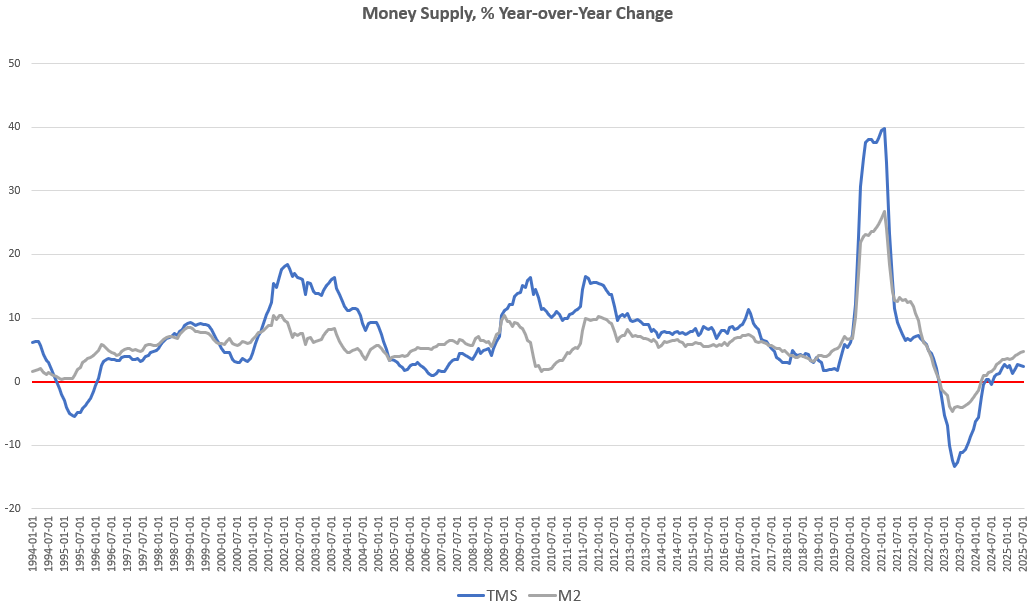
This trend has been especially true in the first half of 2025. Month over month, the money supply in July was up by 0.13 percent, rising only slightly from June’s month-to-month growth rate -0.17 percent. During July of last year, the month-to-month growth rate was 0.17 percent.
The total money supply has hovered around $19.3 trillion for the past three months, and is little changed from January of this year, rising 0.2 percent, or $39 billion since then.
This flattening of monetary growth likely reflects several trends we now see in the economy. For example, recent employment reports have shown that job growth has largely stalled, and July’s revisions to employment totals suggest that employment trends are worse than was previously thought. Moreover, recent reports from the Federal Reserve Bank of New York shows that delinquencies on student loans, auto loans, and credit cares are all at or above the levels they were during the Great Recession. Meanwhile, bankruptcies are up by more than 11 percent in 2025 compared to last year, and pending home sales continue to fall.
All of these trends are likely to have an effect on money supply growth. As Frank Shostak has explained, the money supply will often grow along with loan activity at commercial banks, and increases in loan activity requires an abundance of credit-worthy borrowers. As delinquencies and bankruptcies rise—a trend made worse by stagnating employment—the number of available borrowers falls. Fewer loans will then be made and the money supply will grow less swiftly. On the other end, a growing number of defaulting borrowers means previously lent dollars will “disappear” as these loans are never paid back, putting downward pressure on the overall money supply. As home-sale totals fall, this also tends to mean fewer newly lent dollars entering the economy.
All of this together is a recipe for diminishing growth in the money supply. When combined with the Fed’s recent reluctance to lower the target policy interest rate—which has meant fewer monetary injections from the Fed’s open market operations— we’re now seeing a flattening in the overall money supply.
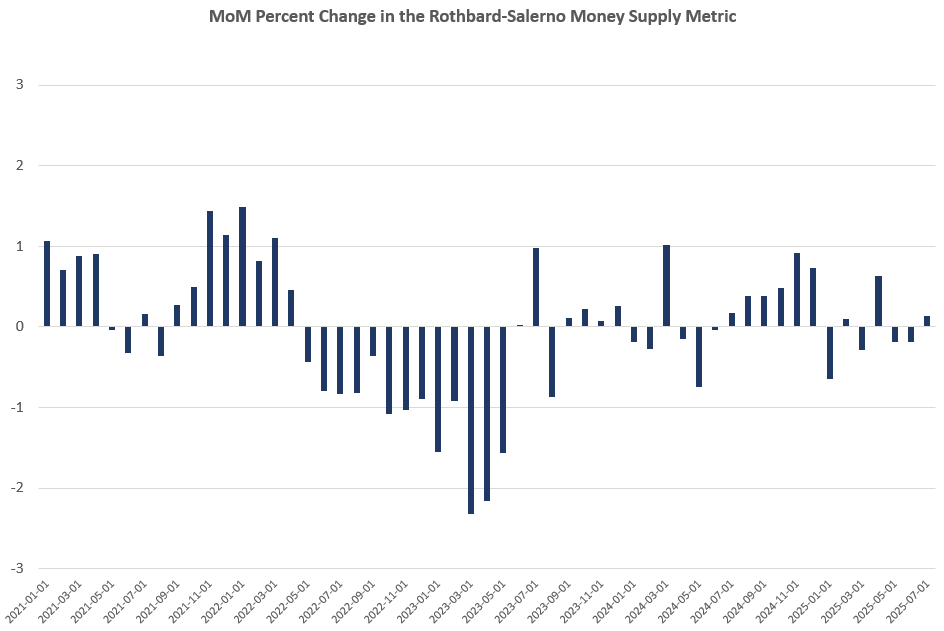
The money supply metric used here—the “true,” or Rothbard-Salerno, money supply measure (TMS)—is the metric developed by Murray Rothbard and Joseph Salerno, and is designed to provide a better measure of money supply fluctuations than M2. (The Mises Institute now offers regular updates on this metric and its growth.)
Historically, M2 growth rates have often followed a similar course to TMS growth rates, but M2 is now growing considerably faster than TMS, and a gap between the two measures has gradually widened. In July, the M2 growth rate, year over year, was 4.79 percent. That’s up from June’s growth rate of 4.51 percent. July’s growth rate was also up from July 2024’s rate of 1.54 percent. Month over month, M2 has also grown faster than TMS, rising by 0.33 percent from June to July.
Although year-over-year and month-to-month growth rates may be moderating, money-supply totals remain far above what they were before 2020 and the covid panic. From 2020 to 2022, the Federal Reserve’s easy-money policies resulted in approximately 6.4 trillion dollars being added to the economy. This was done to help to finance the federal government’s enormous deficits driven by runaway covid stimulus programs. Although the total size of the money supply has fallen since mid 2022, it has certainly not fallen enough to return money supply growth to the pre-covid trend, and the total money supply as of July remains five trillion above where it was at the beginning of 2020.
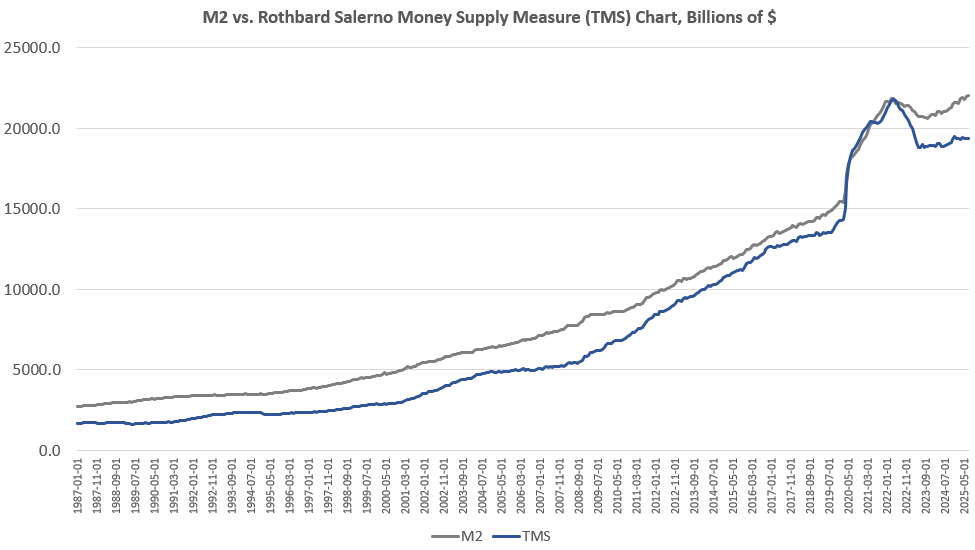
Since 2009, the TMS money supply is now up by nearly 194 percent. (M2 has grown by nearly 156 percent in that period.) Out of the current money supply of $19.3 trillion, nearly 26 percent of that has been created since January 2020. Since 2009, in the wake of the global financial crisis, more than $12 trillion of the current money supply has been created. In other words, nearly two-thirds of the total existing money supply have been created just in the past thirteen years.
As a result money-supply is now well above the former trend that was in place before 2020. For example, just to get to back to the money-creation trend that existed in 2019 before the “great covid inflation,” total money supply would need to fall by at least three trillion dollars.
Why Is There a Growing Gap Between M2 and TMS?
But why is there a growing gap between M2 and TMS, and does it mean anything? To answer the first part of this question we need to consider how M2 is calculated differently from TMS. First, TMS includes Treasury deposits at Federal Reserve banks, while M2 does not. These deposits have fallen by nearly $200 billion since January. This has brought down TMS totals, but has not directly reduced M2. Moreover, M2 does include retail money funds while TMS does not include these funds as money. So, with retail money funds increasing by more than $100 billion since January we’re seeing more upward pressure on M2 than on TMS. These are just two factors that are helping to form an ongoing gap between M2 and TMS.
Does this gap matter? Historically, a large and growing gap between M2 and TMS has suggested in several cases that the US economy has already entered a recession. Looking back to the months before the onset of recession in 1990, 2001, and 2007, we find that the gap between TMS and M2 was near a new peak in each case. A similar phenomenon happened in late 2019 along with the repo crisis of that year. This was likely a prelude to a 2020 recession that would have happened had the central bank not intervened to push extreme levels of new liquidity during the covid panic. Now, in mid 2025, this gap is now the largest it has been in decades—and possibly ever.
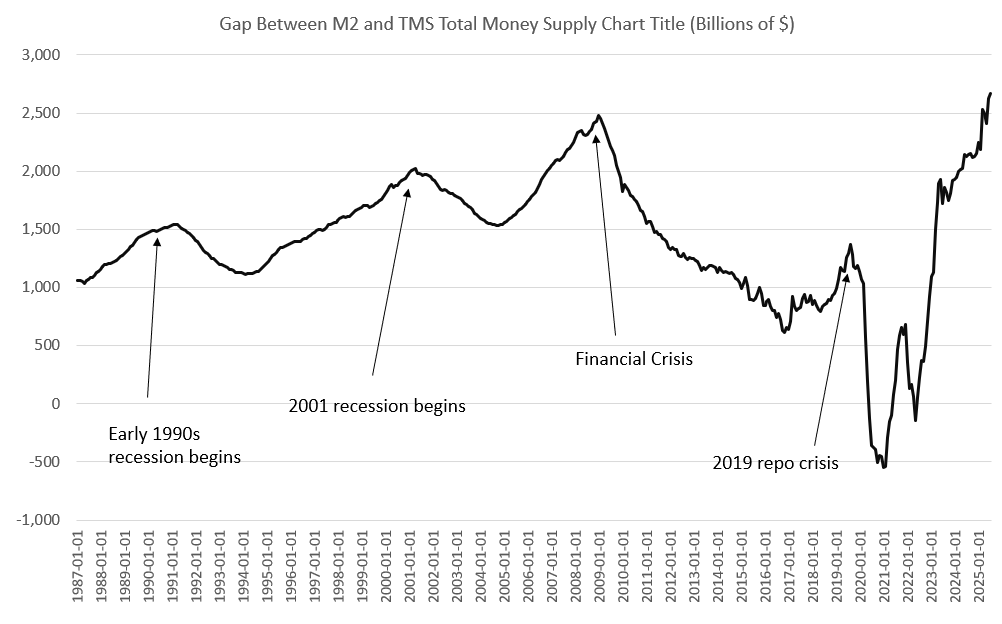
This doesn’t prove that the US is in the midst of a recession at the moment, but the growing gap between M2 and TMS suggests that the US is, at least, entering a period of serious economic weakness.

QTR’s Disclaimer: Please read my full legal disclaimer on my About page here. This post represents my opinions only. In addition, please understand I am an idiot and often get things wrong and lose money. I may own or transact in any names mentioned in this piece at any time without warning. Contributor posts and aggregated posts have been hand selected by me, have not been fact checked and are the opinions of their authors. They are either submitted to QTR by their author, reprinted under a Creative Commons license with my best effort to uphold what the license asks, or with the permission of the author.
This is not a recommendation to buy or sell any stocks or securities, just my opinions. I often lose money on positions I trade/invest in. I may add any name mentioned in this article and sell any name mentioned in this piece at any time, without further warning. None of this is a solicitation to buy or sell securities. I may or may not own names I write about and are watching. Sometimes I’m bullish without owning things, sometimes I’m bearish and do own things. Just assume my positions could be exactly the opposite of what you think they are just in case. If I’m long I could quickly be short and vice versa. I won’t update my positions. All positions can change immediately as soon as I publish this, with or without notice and at any point I can be long, short or neutral on any position. You are on your own. Do not make decisions based on my blog. I exist on the fringe. If you see numbers and calculations of any sort, assume they are wrong and double check them. I failed Algebra in 8th grade and topped off my high school math accolades by getting a D- in remedial Calculus my senior year, before becoming an English major in college so I could bullshit my way through things easier.
The publisher does not guarantee the accuracy or completeness of the information provided in this page. These are not the opinions of any of my employers, partners, or associates. I did my best to be honest about my disclosures but can’t guarantee I am right; I write these posts after a couple beers sometimes. I edit after my posts are published because I’m impatient and lazy, so if you see a typo, check back in a half hour. Also, I just straight up get shit wrong a lot. I mention it twice because it’s that important.
64% of all money in circulation has been printed since 2009. The other 36% was printed over the previous 100+ years.
They need to stop printing money for the next 20 years. Slash government spending and let the private sector to flourish.
Thank You for this piece...very informative...I have become a fan of Austrian Economics...It is interesting to see the impact of the internet in so many ways...just "google" Mises institute and read the Wikipedia definition; "The Ludwig von Mises Institute for Austrian Economics, or Mises Institute, is a nonprofit think tank headquartered in Auburn, Alabama, that is a center for Austrian economic thought, right-wing libertarian thought, and the paleolibertarian and anarcho-capitalist movements in the United States." But visit the Mises Institute website and in their Mission Statement you will find this; "Founded in 1982 by Llewellyn H. Rockwell, Jr., with the blessing and aid of Margit von Mises, Murray N. Rothbard, Henry Hazlitt, and Ron Paul, the Institute seeks a free-market capitalist economy and a private-property order that rejects taxation, monetary debasement, and a coercive state monopoly of protective services.
Non-political, non-partisan, and non-PC, the Institute works with students and scholars from many countries, and reaches out to business leaders, professionals, and everyone else interested in our mission. We believe that our foundational ideas are of permanent value, and oppose all efforts at compromise, sellout, and amalgamation of these ideas with fashionable political, cultural, and social doctrines inimical to their spirit." What is Right Wing Libertarian thought?
Which brings me to your post...The argument of the very existence of the Fed reveals a division (similar to politics, eh?) Is Jerome Powell an anti Trump Fed President? The debate as to the origins of the Great Financial Crisis are many...One I read went so far as to blame the Clinton Administration due to their programs to make housing more affordable for low income Americans...and providing mortgages that would eventually crush them...similar to 2006 when Housing Balloon Loans became the norm...Personal Fiscal responsibility has ceased to exist as there is no longer any real impact of filing for Bankruptcy...My father was a Depression Baby who's family was wiped out...He didn't even use a credit card personally...I think we should all blame Paul Volcker...since he rescued the American Economy through tough love...Which is probably what is needed right now...In the immortal words of Alan Greenspan; "The United States can pay any debt it has because we can always print money to do that. So there is zero probability of default."