

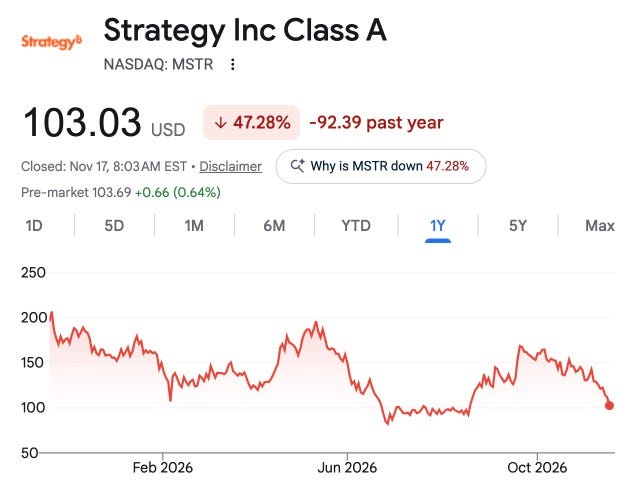
Strategy common stock is down about -34.4% year to date and -47.2% over the last twelve months. The stock is about -75% from its all time highs. I’ve been critical of the company for the last year, whereas others whom I respect, like my friend Larry Lepard, have made peace with what they are trying to do. Here’s a nuanced debate with me and Larry from July for those wanting both sides of the argument.
But today I want to point out again that during the last year, as performance has waned, Michael Saylor and Strategy appear to have repeatedly changed and reintroduced metrics used to communicate the company’s performance this year to the point where it’s starting to feel egregious.
Here’s as best as I can see things:
In February, CNBC ran a Michael Saylor interview where he said “I expect we’ll be buying bitcoin every quarter forever…”
In February, the company’s focus appeared to be BTC Yield and BTC Gain, prominently featured in the company’s Q1 earnings report.
In May, Strategy appeared to test the market and, in fact, sold bitcoin.
In May, CEO Phong Le called “Bitcoin per share” the company’s “True North”. He also said “…Bitcoin per share accretion is our primary goal.”
In July, Strategy redefined mNAV and introduced Net Bitcoin Per Share and BTC Hurdle ARR.
In July, it was reported Strategy sold more bitcoin. Strategy disclosed that it had sold approximately $218.4 million of Bitcoin year-to-date to fund preferred stock dividends.
In October, it revised historical BTC Yield calculations.
In October, Strategy reported negative year-to-date results for the very metrics it had previously emphasized: BTC Yield of negative 3.7%, BTC Gain of negative 24,947 BTC, and BTC $ Gain of negative $2.03 billion, as of October 25.
By November, Strategy was prominently displaying additional metrics including "Amplification," "Net Leverage," "BTC Duration," and "USD Duration". Its dashboard had expanded into an increasingly complex collection of proprietary measures describing the company's Bitcoin exposure, capital structure, and financial resilience.
Now, in November, Saylor is promoting yet another metric: USD Strength.
It’s all so exhausting, isn’t it? I’ve seen a lot of companies move goalposts over time when the metrics aren’t telling the story they want to tell. But I’m not sure I’ve seen this many changes, so quickly. I mean, look at all this shit:
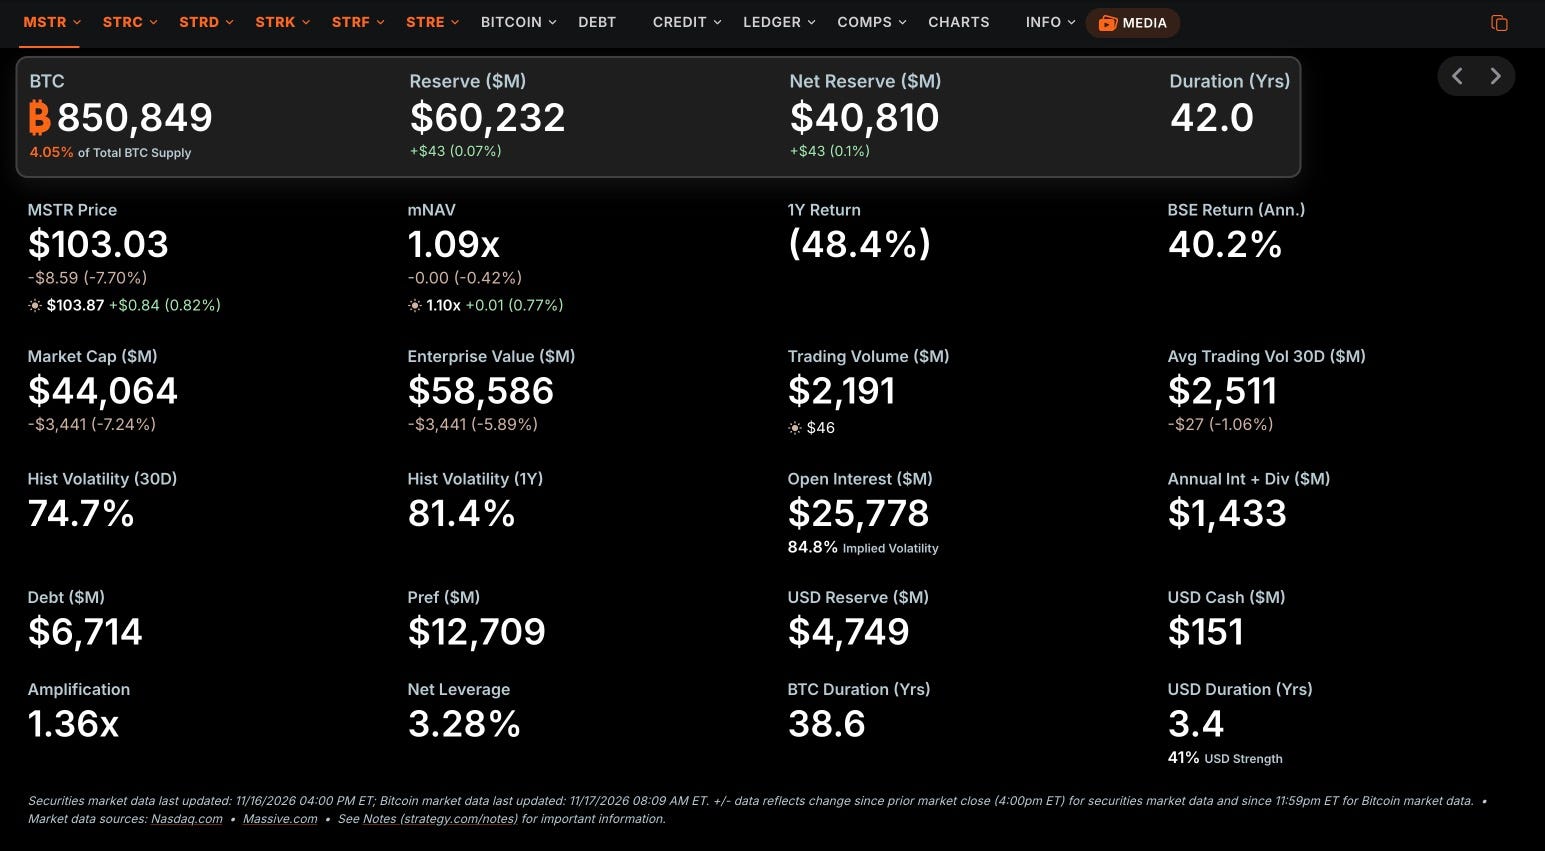
At some point, investors have to ask: Is Strategy improving its performance, or simply changing how performance is measured in the hopes of changing or inventing a dashboard metric to distract from this chart:
But as 2026 progressed, the scoreboard became considerably more complicated. And now, in November, Saylor has introduced yet another headline metric.