

The US government has borrowed over $800B in the last three months. This is a gargantuan sum of money that annualizes to ~$3.2T. This is an astonishing amount of money given the economy is not technically in recession. If there is an even a minor bump in the economy, the government spending will have to increase which is going to drive this number even higher.
Note: Non-Marketable consists almost entirely of debt the government owes to itself (e.g., debt owed to Social Security or public retirement)
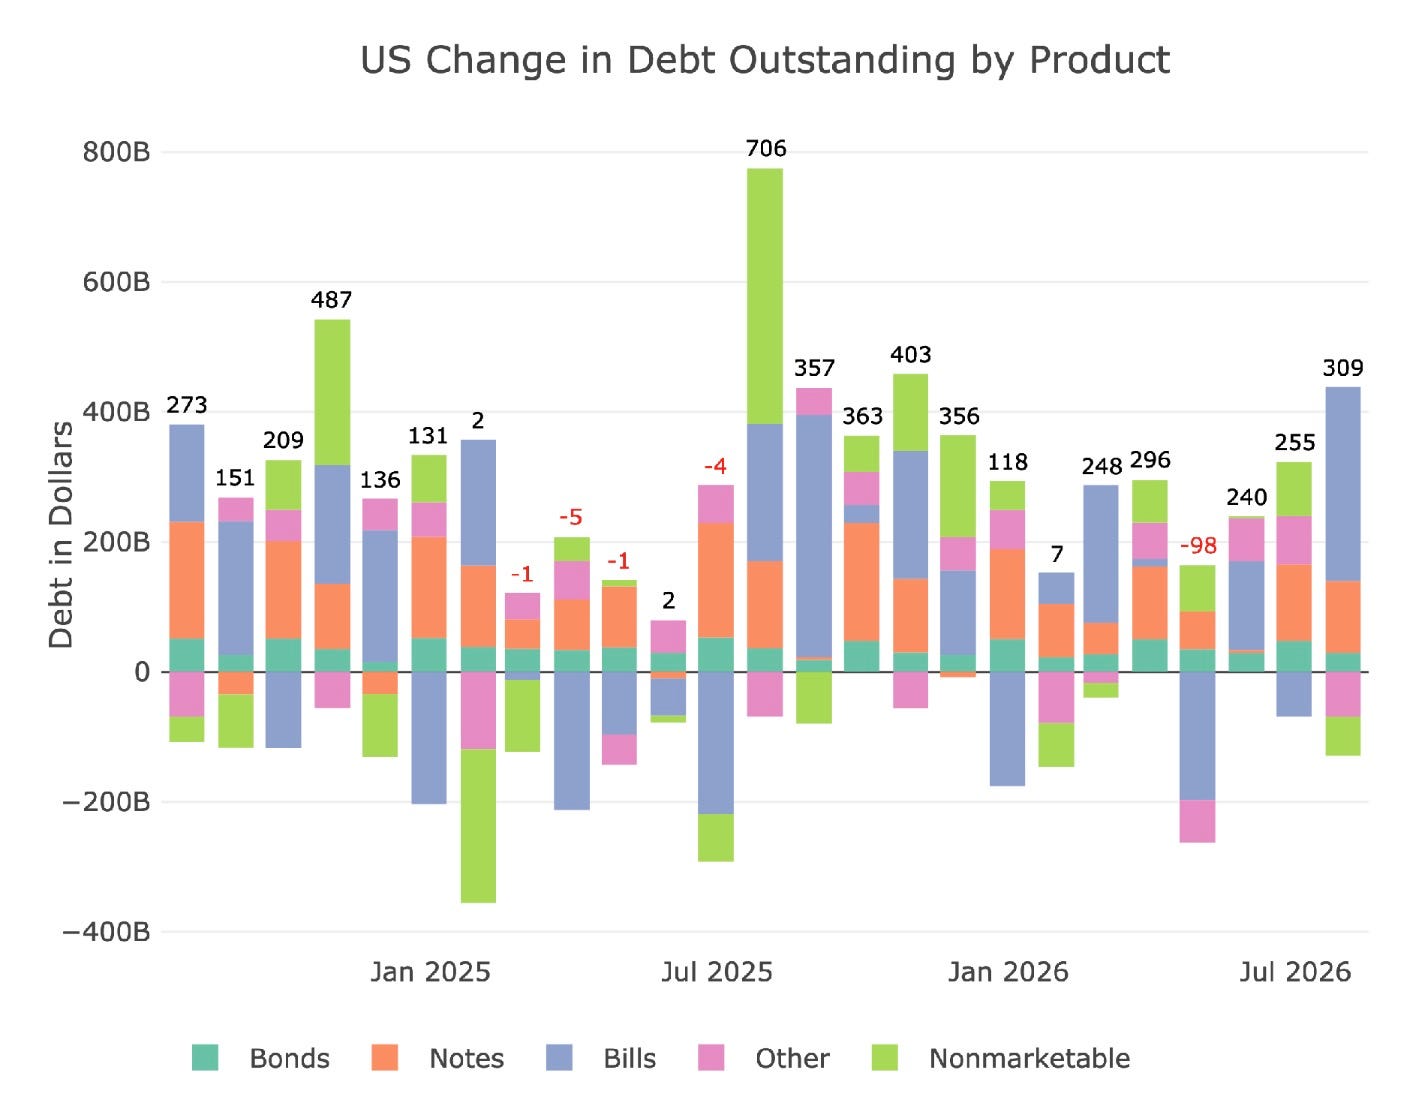
Figure: 1 Month Over Month change in Debt
Due to the massive debt issuance, the treasury is relying Bills (short-term debt) more and more. The appetite for long term debt is simply not big enough. You can see how the trend has changed over time. In the early 2010s the bulk of debt issuance was in Notes (2-10 years). Even in 2025, Notes made up a substantial portion. However, in 2026 you can see that Bills are making up an ever-larger portion of the total debt issuance.
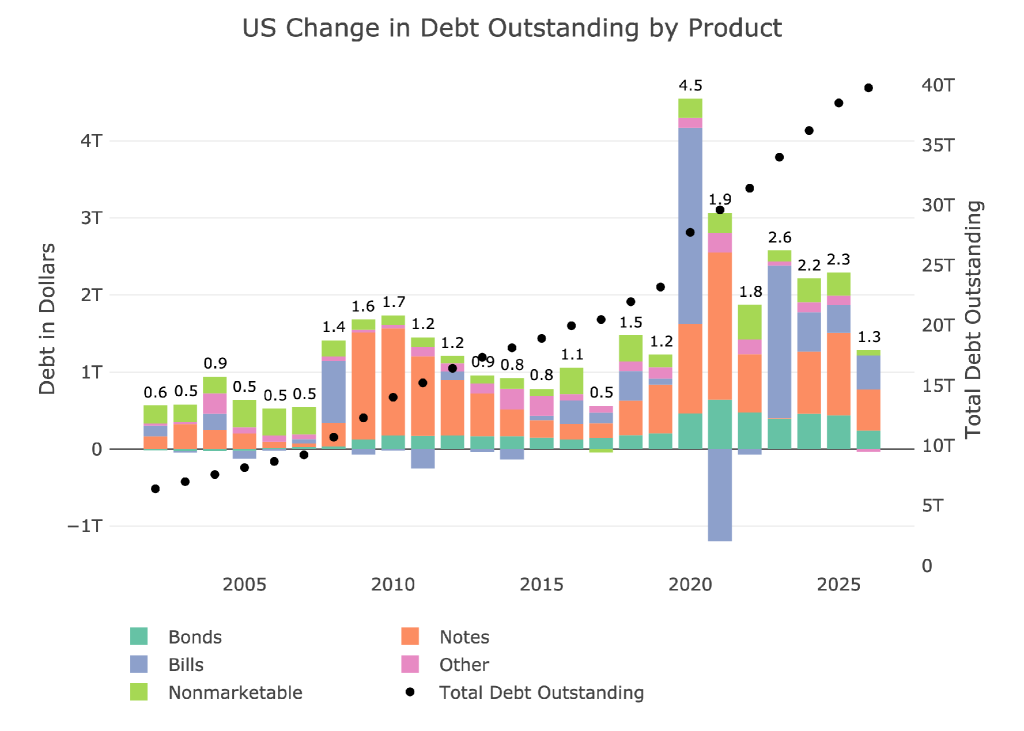
Figure: 2 Year Over Year change in Debt
One good piece of news is that the Treasury has strengthened their cash position to $1T.
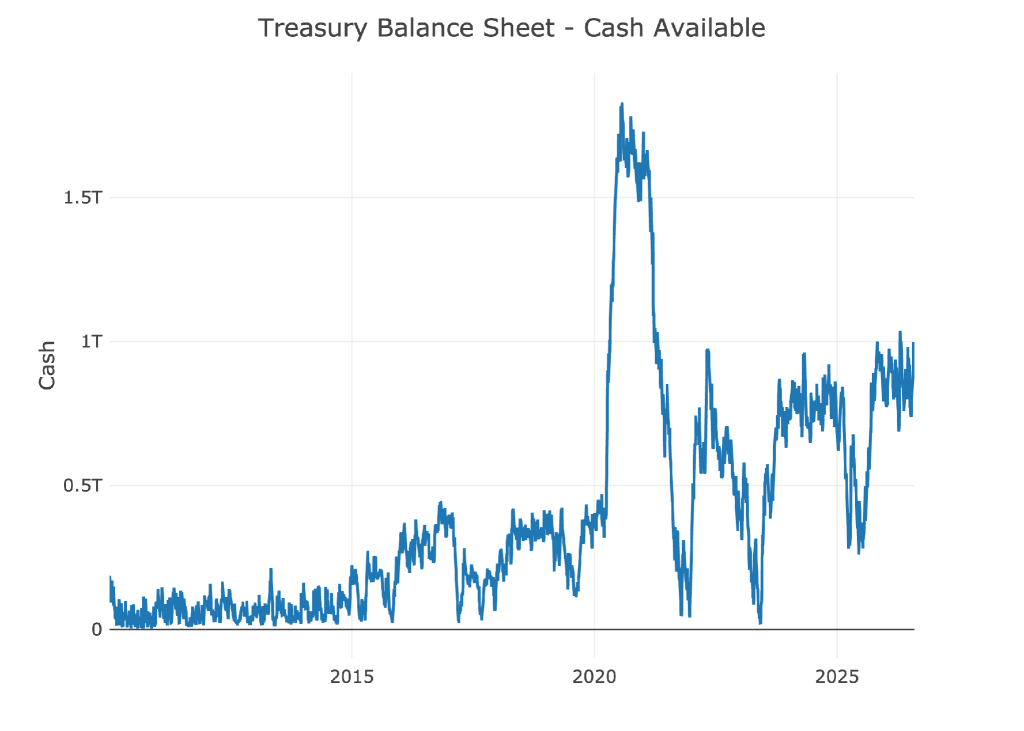
Figure: 3 Treasury Cash Balance
The chart below shows both the maturity of the debt and average interest rate. The blended interest rate has stabilized around 3.1%. More concerning is the average maturity of the debt is now around 5.9 years. Lower average maturity means the government will have to roll over more debt each year. It increases the risk if the appetite for US debt starts to slow or holders turn into net sellers.
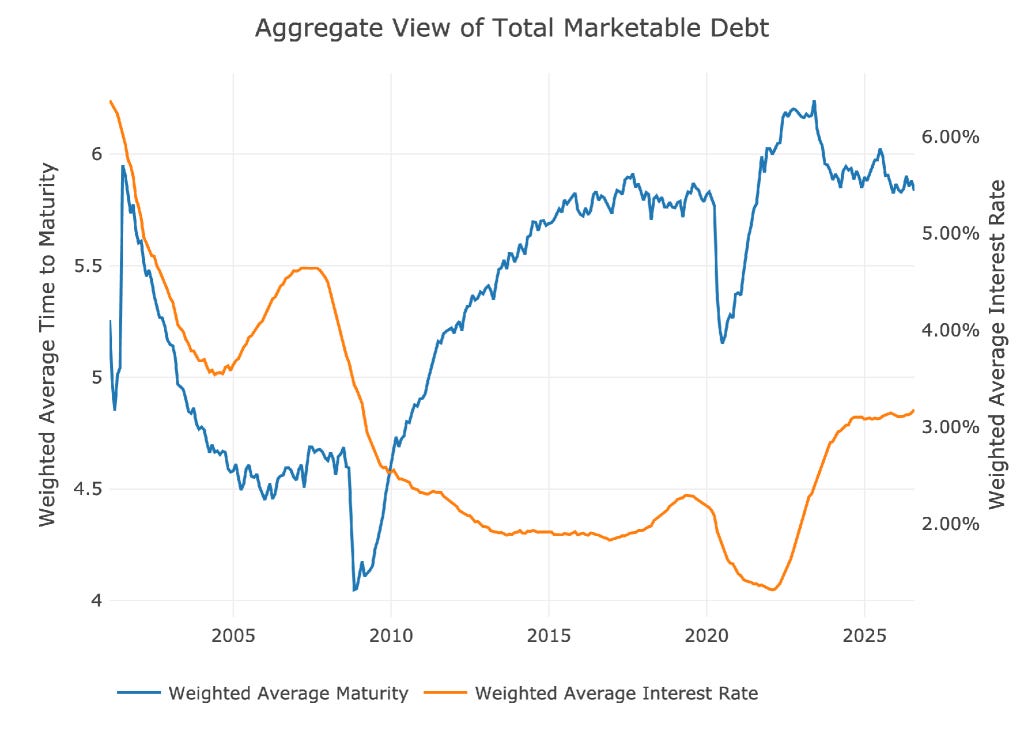
Figure: 4 Weighted Averages
The true danger facing the government is still in the massive interest currently being paid on the debt. Interest now sits above $1T a year! As shown in the chart, about half of this is concentrated in Notes, which is debt maturing between 2 and 10 years. You can also see the massive increase in interest tied to notes. This is the primary reason the Fed cannot raise rates. If the Fed raises short-term rates, it only drives interest expenses up. It is already unsustainable.
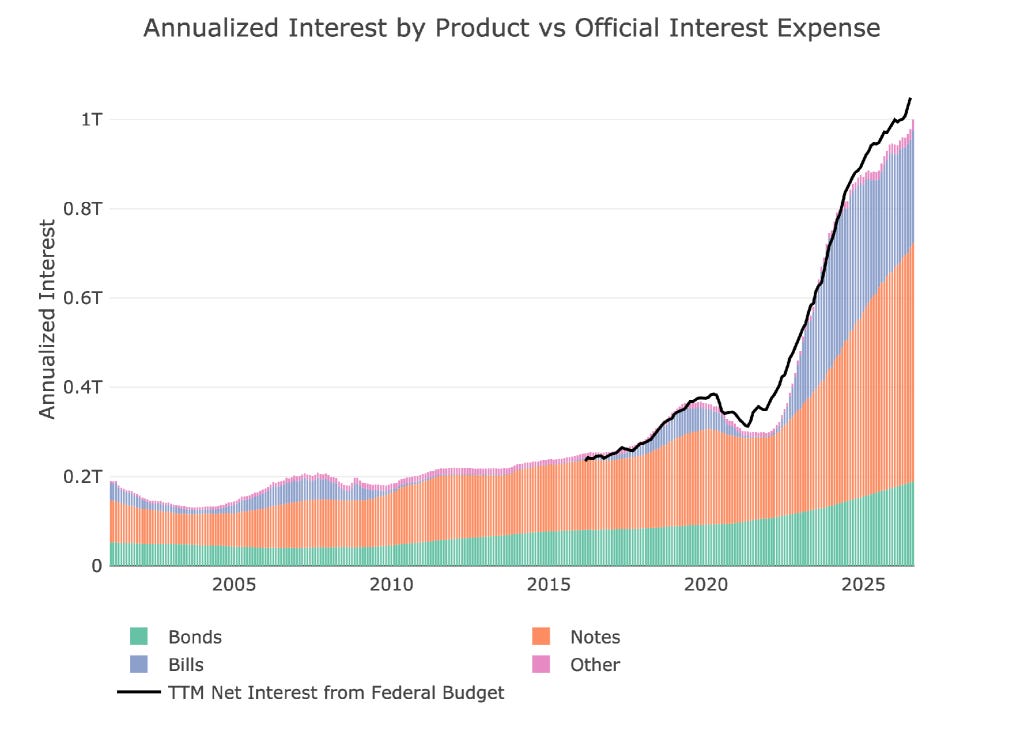
Figure: 5 Net Interest Expense
A lot is unknown about how Warsh will manage interest rates, but assuming the Fed simply stays put, combined with the rolling maturity of the debt, we can forecast out the cost of the debt going forward. Again, the Treasury left “debt affordability” in the rearview mirror in 2021. The Treasury is now absolutely hemorrhaging cash on debt service costs, set to rise over $1.2T in 2027.
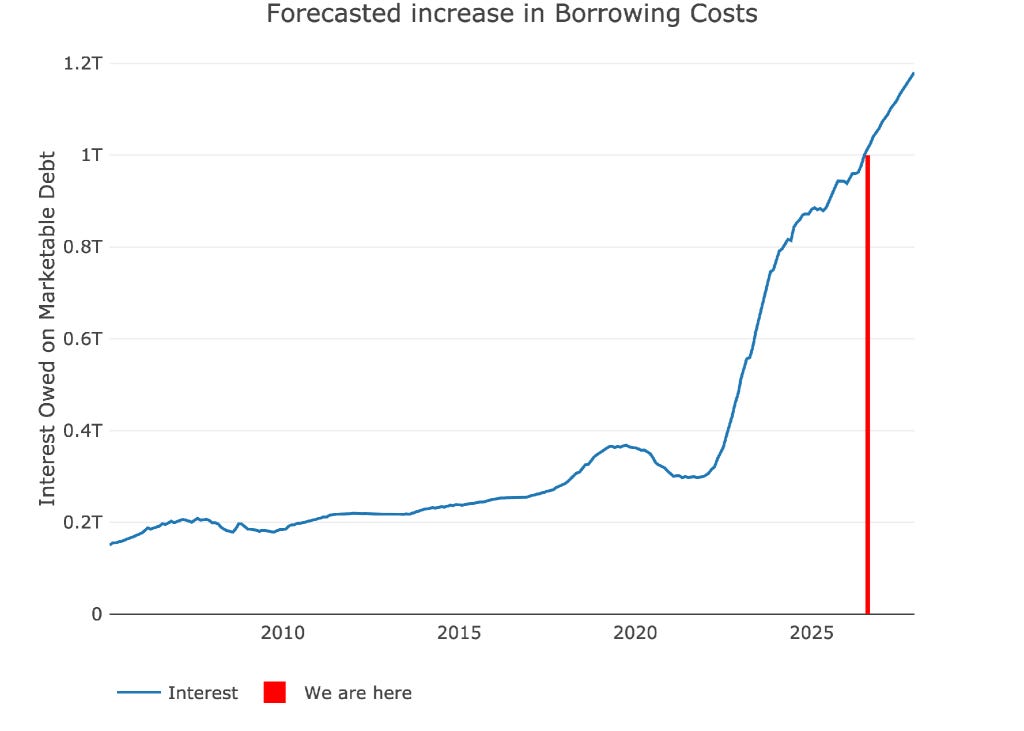
Figure: 6 Projected Net Interest Expense
Speaking of debt issuance and rollover, the chart below shows the forecasted debt maturing for 2-10 year maturities. Debt rolling over will be $600B higher in 2026 than it was in 2025. There will be another $500B increase in rollover in 2027. This will bring the total to $3.4T! This is all just existing debt, nothing new. That means in 2027 total note issuance could exceed $5T which greatly increases our interest rate risk.
Note “Net Change in Debt” is the difference between Debt Issued and Debt Matured. This means when positive it is part of Debt Issued and when negative it represents Debt Matured
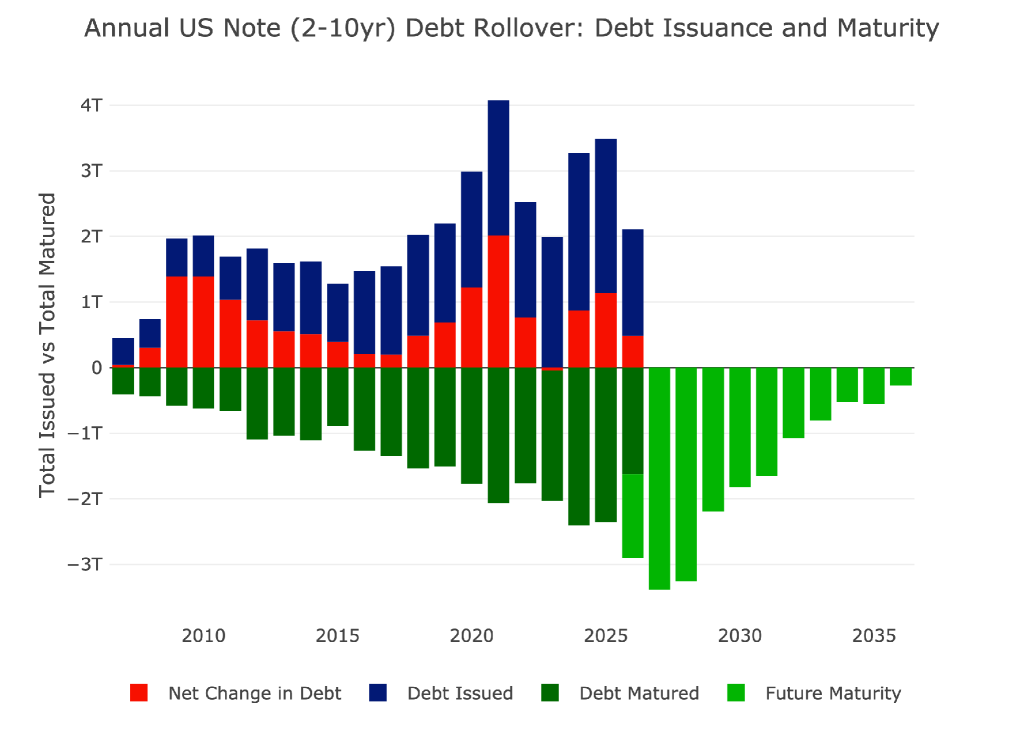
Figure: 7 Treasury Note Rollover
Yield Curve
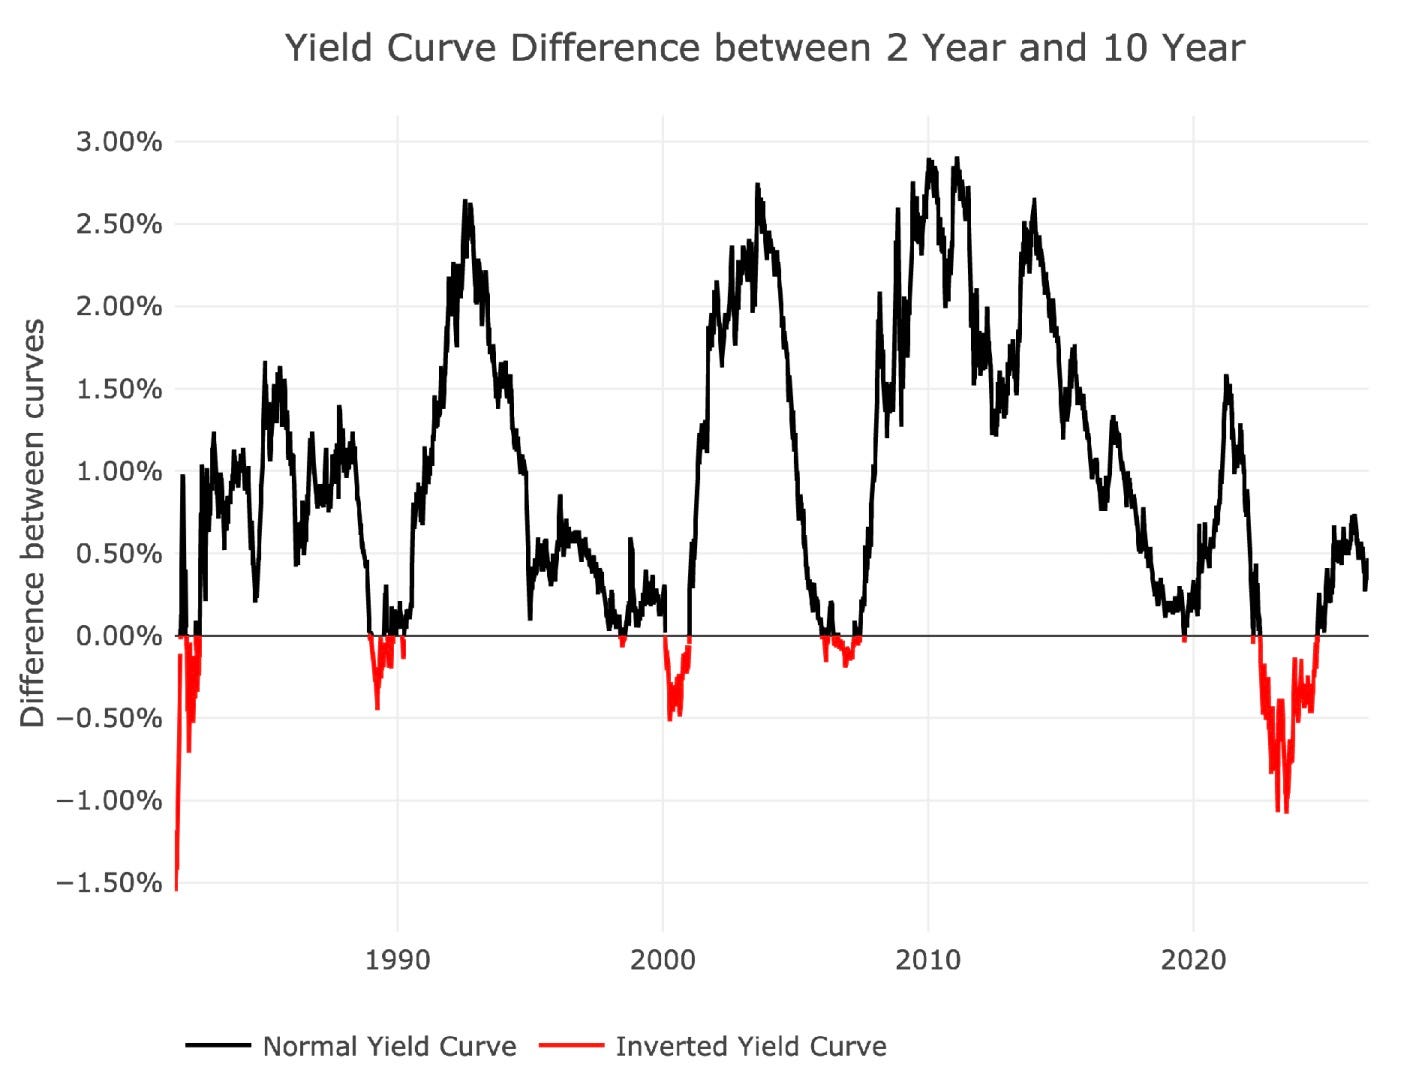
The yield curve has gone back to positive sloping between the 2 and 10 year. The Treasury was borrowing short-term the entire time it was inverted which seems like an odd decision. The current thinking is that Warsh may have to actually raise rates, but he is clearly hesitant to do so.
Figure: 8 Tracking Yield Curve Inversion
Historical Perspective
The chart and table below show how the debt and interest has changed over time.
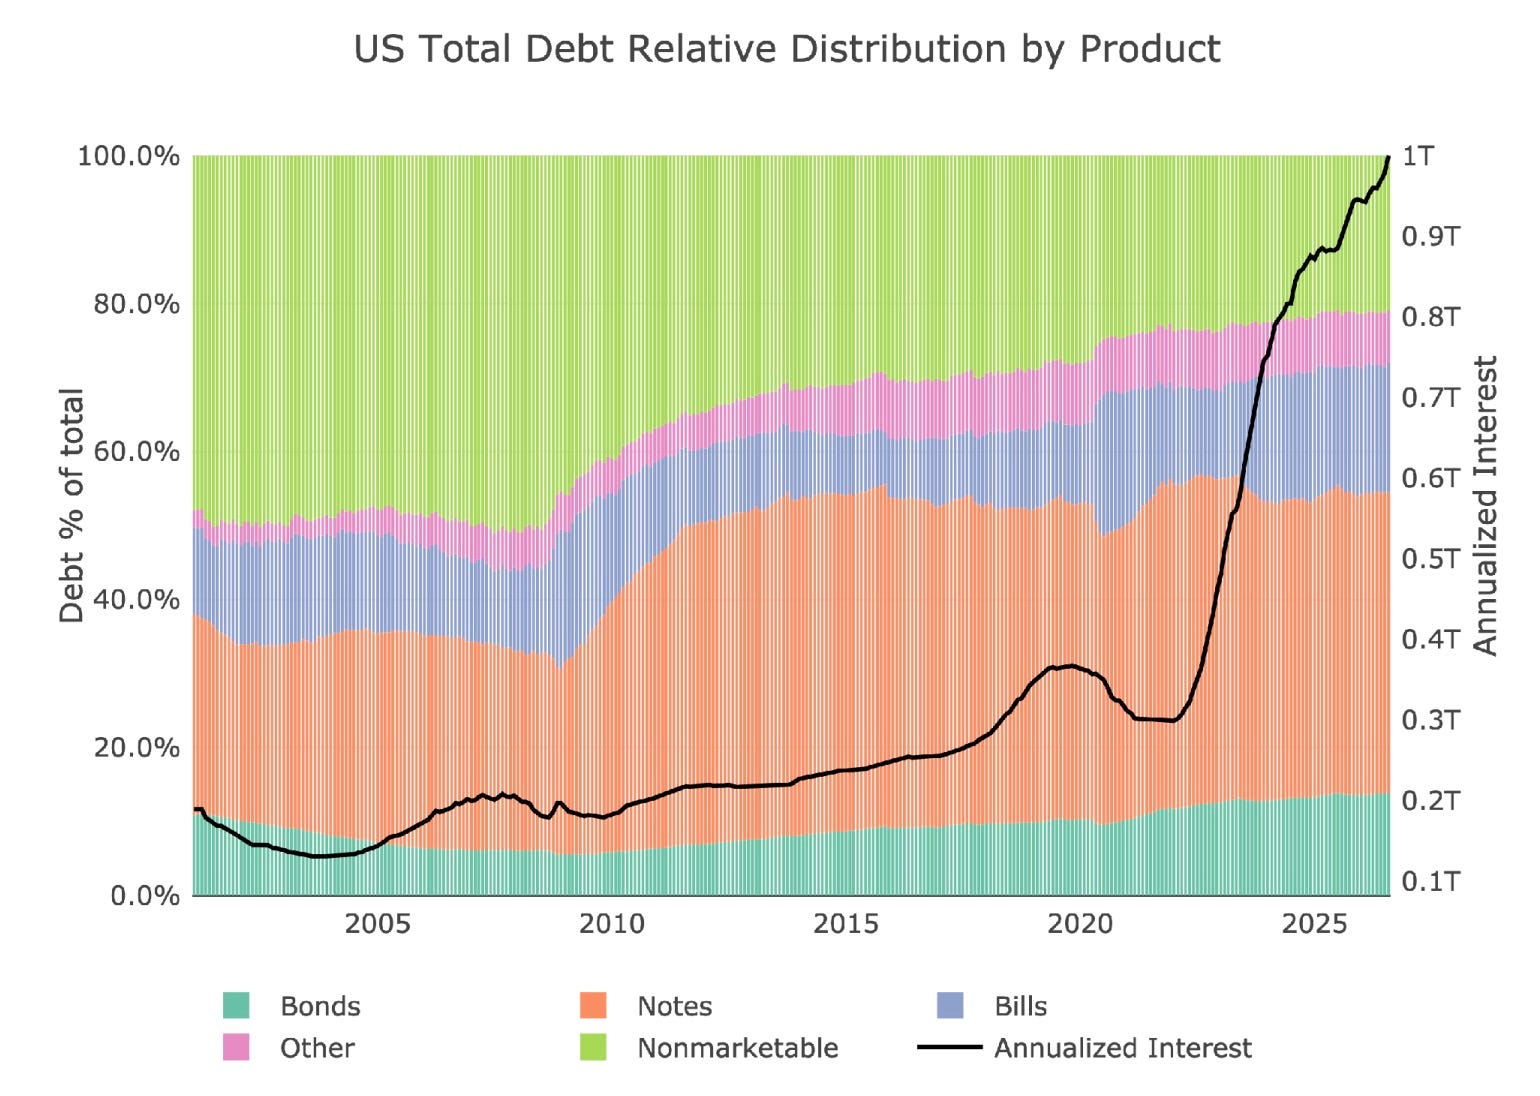
Figure: 9 Total Debt Outstanding
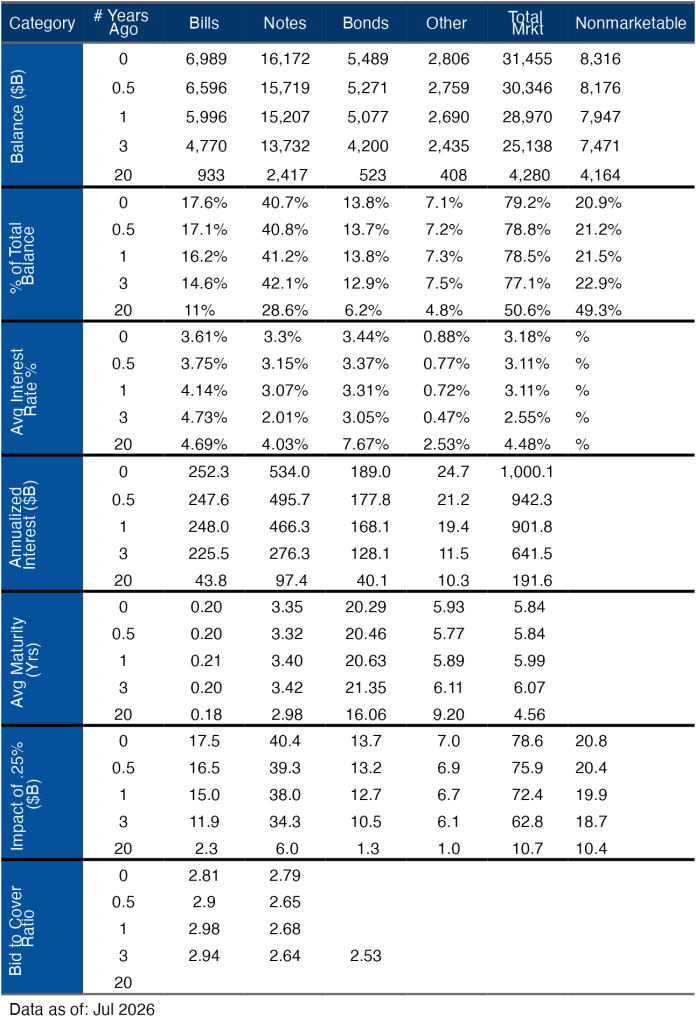
Figure: 10 Debt Details over 20 years
Wrapping Up
The US fiscal situation is completely out of control. With the government set to exceed $40T in total debt within a few months, one has to ask how and when does this all end. $1T in annual interest payments is a massive thorn in the side of the US budget situation. Adding $3T a year in new debt ($90B in interest per year) means that in ~3 years the US will cross $50T with an extra $600B per year in interest.
Keep in mind that may be a conservative estimate. It’s more likely that debt could increase even faster which only accelerates the downward spiral. There is no way out of this situation except through inflation. The government has no appetite to cut spending. Warsh can talk tough, but the math indicates he has no choice but to keep the printing presses rolling, which means inflation will only move higher.

QTR’s Disclaimer: Please read my full legal disclaimer on my About page here. This post represents my opinions only. In addition, please understand I am an idiot and often get things wrong and lose money. I may own or transact in any names mentioned in this piece at any time without warning. Contributor posts and aggregated posts have been hand selected by me, have not been fact checked and are the opinions of their authors. They are either submitted to QTR by their author, reprinted under a Creative Commons license with my best effort to uphold what the license asks, or with the permission of the author. I cannot guarantee the accuracy of all facts and figures included in this article though I made my best effort to get them right. I have been wrong before and will be wrong again, and encourage you to always double check, do your own research and speak to a licensed financial professional.
This is not a recommendation to buy or sell any stocks or securities, just my opinions. I often lose money on positions I trade/invest in. I may add any name mentioned in this article and sell any name mentioned in this piece at any time, without further warning. None of this is a solicitation to buy or sell securities. I may or may not own names I write about and are watching. Sometimes I’m bullish without owning things, sometimes I’m bearish and do own things. Just assume my positions could be exactly the opposite of what you think they are just in case. If I’m long I could quickly be short and vice versa. I won’t update my positions.
As of May 20, 2026 I am attempting to no longer actively trade as much as I once did (read my story here). My eventual goal is for investing/saving to be mostly done by recurring contributions mostly to sector ETFs and a few select equities, trusted third parties who oversee my accounts, and advisors. Such advisors or funds, through individual equities, options, index funds, mutual funds, ETFs, or other securities, may have positions in, exposure to, or holdings of names mentioned herein that I know nothing about. Basically, via index funds, ETFs and individual equities it is possible I could own, have exposure to, or not own anything at any point. As of the same date, May 20, 2026, in an attempt to lead a healthier lifestyle, I’ve also excluded myself from fantasy sports, sports betting, online and in-person casinos and prediction markets.
And all positions can change immediately as soon as I publish this, with or without notice and at any point I can be long, short or neutral on any position. You are on your own. Do not make decisions based on my blog. I exist on the fringe. If you see numbers and calculations of any sort, assume they are wrong and double check them. I failed Algebra in 8th grade and topped off my high school math accolades by getting a D- in remedial Calculus my senior year, before becoming an English major in college so I could bullshit my way through things easier.
The publisher does not guarantee the accuracy or completeness of the information provided in this page. These are not the opinions of any of my employers, partners, or associates. I did my best to be honest about my disclosures but can’t guarantee I am right; I write these posts after a couple beers sometimes. I edit after my posts are published because I’m impatient and lazy, so if you see a typo, check back in a half hour. Also, I just straight up get shit wrong a lot. I mention it twice because it’s that important.
Project Zmbabwe. I don't see this ends well for those who don't have precious metals as insurance.
Expect them to start getting extremely creative when calculating those CPI numbers.